COVID 1-Year Later: Where are We Now?
March 15, 2021

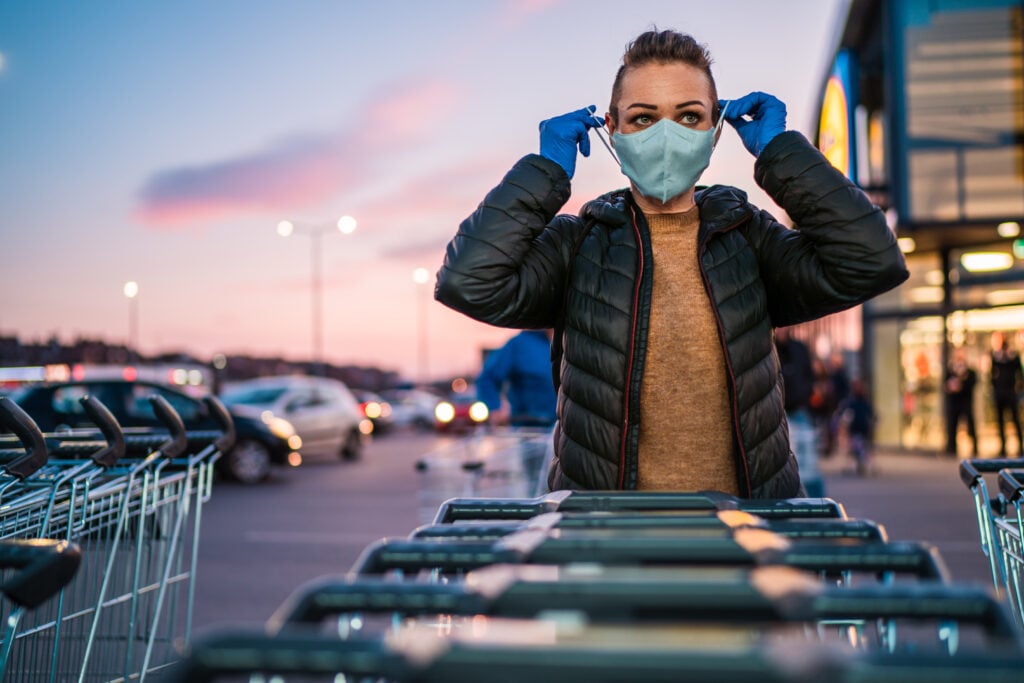
It’s been a full year since COVID-related lockdowns took effect — shutting down schools, restaurants, gyms, shops, and salons — while state and local governments figured out how best to move forward and keep residents safe. A year later, there are three vaccines but no agreed-upon approach to managing both the virus and its impact on our economy. Some states, like California, chose the path of prolonged shutdowns in a focused attempt to stem the spread of the virus. Other states, like Iowa, remained resolutely open. Cities, too, concerned with spiking infection rates, sometimes found themselves at odds with the more laissez-faire (or restrictive) approach of their respective states.
Location Intelligence Measures Coronavirus Economic Impact
Knowing that consumer behavioral data could provide us with a more complete picture of what has happened around the country since the onset of COVID-19, we took a broad look at our foot traffic data across all 50 states and 50 of our largest cities. We focused on some key place categories — Accommodations, Restaurant & Food, Shopping, and Transportation — as well as on local, “mom-and-pop” businesses to see how each is faring at the 1-year mark. Where have people changed their behavior (or not) in response to the virus? How has this impacted the businesses in each category, and by extension, the employees who work there? What has it meant for small, locally-owned businesses that are more likely to rely on local foot traffic — and less likely to move operations online?
Here’s what we learned:
Accommodations – ↓ 49% Nationwide
One of the most impacted categories overall, foot traffic at Accommodations remains down year-over-year in every U.S. state. Smaller and outdoor-centric establishments like Lodges (-23%) and Golf Resorts (-23%) continue to outperform larger Hotels and Destination Resorts. This is most likely because these smaller lodging options are more conducive to social distancing. A year later, hotels and other accommodations in the southern states of Florida, Mississippi, and South Carolina, and in the northeastern states of New Hampshire and Vermont have fared better than those elsewhere.
Restaurants – ↓ 21% Nationwide
Overall, restaurants in the Southeast — in states like Alabama, Mississippi, and South Carolina, and in cities including Knoxville, TN and Jacksonville, FL — retained more of their foot traffic than those in other locations. However, restaurant-goers everywhere universally favored quick-service restaurants conducive to takeout over more traditional, sit-down options. In February 2021, Donut Shops (-6%), Fast Food Restaurants (-14%), and Ice Cream Shops (-14%) still appealed to many U.S. consumers looking to get out of the house for a quick bite.
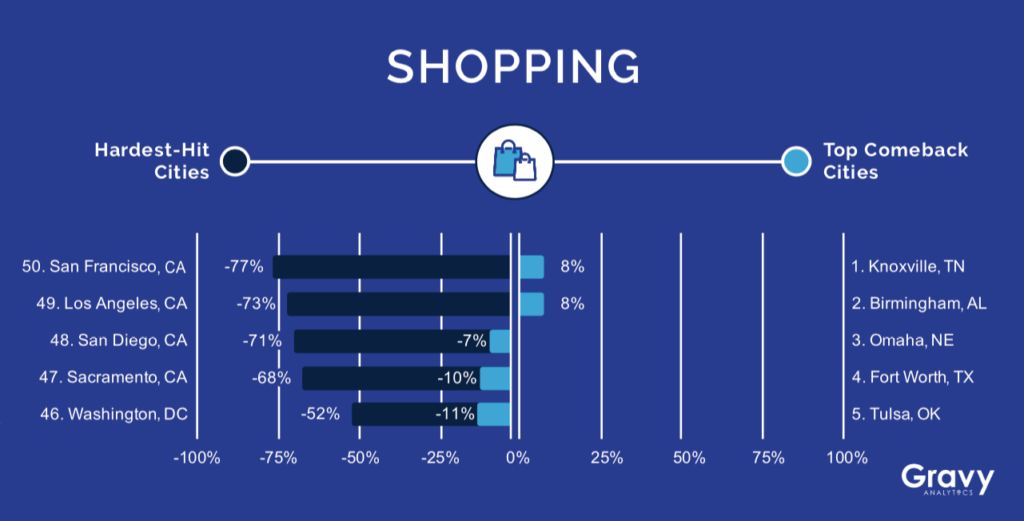
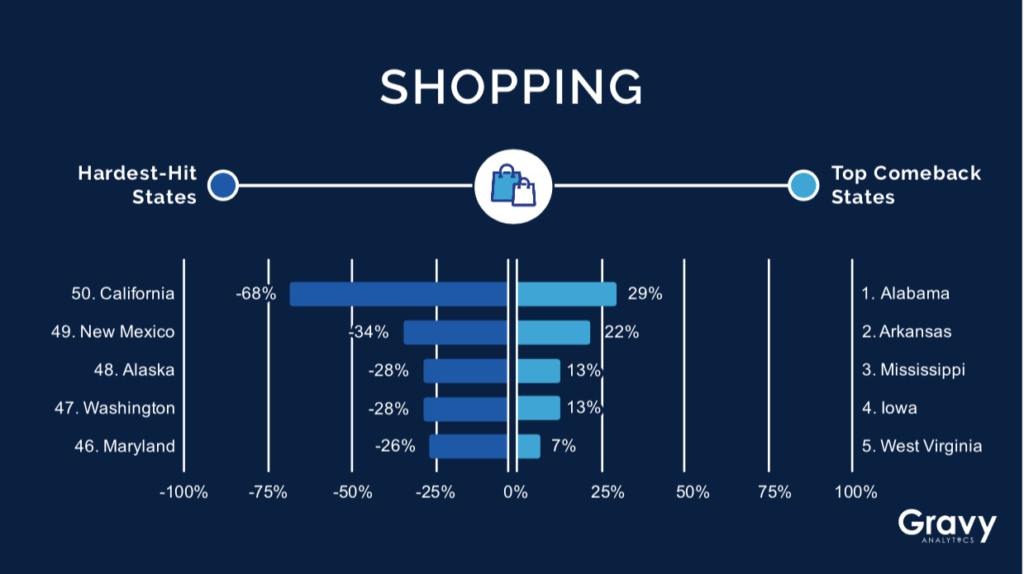
Shopping – ↓ 16% Nationwide
Despite being one of the least impacted commercial categories, Shopping has seen its fair share of changes during the past 12 months. Some shopping destinations, especially those placing an emphasis on value and daily necessities, have enjoyed strong foot traffic throughout the pandemic. These include Wholesale (-1%), Discount (-8%), Food (-7%), and Hardware stores (-11%); foot traffic to Card & Gift stores (-7%) also peaked during the month of February. Foot traffic to shopping destinations in the South and Midwest remains considerably higher than on the East or West coasts. Stores selling more discretionary and specialty items, including Office Supply and Department Stores, have been particularly challenged to retain foot traffic throughout COVID-19.
Transportation – ↓ 46% Nationwide
Over the past 12 months, consumer foot traffic in the Transportation category has shifted from Buses (-57%) and Trains (-51%) to Public Parking (-23%) and Rental Cars (-27%) with more consumers avoiding public transportation in favor of private vehicles. Airports also saw material declines in foot traffic — with a few key exceptions: in February 2021, Utah and Wyoming, as well as New Hampshire, saw higher than usual foot traffic at airports, specifically. Note that these states currently have few restrictions on interstate travel (although Utah does have a statewide mask mandate and New Hampshire’s relaxed guidelines apply only to New England residents) which might have made each a vacation destination of choice this ski season.
Small Business – ↓ 21% Nationwide
The story of mom-and-pop businesses across categories is a mixed bag. Initially harder hit than their corporate counterparts, mom-and-pop businesses have since regained some footing. As of February 2021, performance largely depends on category of business and business location: while mom-and-pop Car Dealerships (+8%) outperformed the segment, independent Cafes/ Coffee Shops (-30%) underperformed their branded competitors. Business performance was also highly dependent on location, with independent businesses retaining more of their foot traffic in southern states like Mississippi, Tennessee, and Alabama, and small businesses in West coast states like California and Washington withstanding far more impact.
Location Intelligence for Your Re-Opening Strategy
Foot traffic data may not tell the entire story when it comes to understanding COVID-19’s impact on consumer activity and the economy, but it does provide near real-time insight into consumer behavioral changes, illustrating changing priorities, interests, and habits. This ability to understand changes in consumer movement almost as they happen, and to discern differences in behavior by category, and by city or state, makes it an essential part of any COVID-19 impact analysis and re-opening strategy.
Read on to see which states and cities are coming back strong—and where foot traffic lags behind the national average. For even more insights, and to explore our data in full, visit our COVID-19 Economic Activity Dashboard.