COVID-19 and Social Distancing by City
March 27, 2020

Social distancing is quickly becoming a way of life. Given the ever-increasing number of COVID-19 cases and the virus’s ease of transmission, many of us expect to be practicing social distancing for the foreseeable future. We know that U.S. consumers are reacting to the spread of COVID-19 and implementation of social distancing, but how does their reaction vary by city?
Location data derived from consumer mobile devices can provide truer insight into the daily activities of large groups of consumers everywhere. Gravy Data-as-a-Service and the Visitations dataset allows us to effectively measure millions of consumer visits to thousands of commercial places of interest in any city – efficiently and in a privacy-friendly manner.

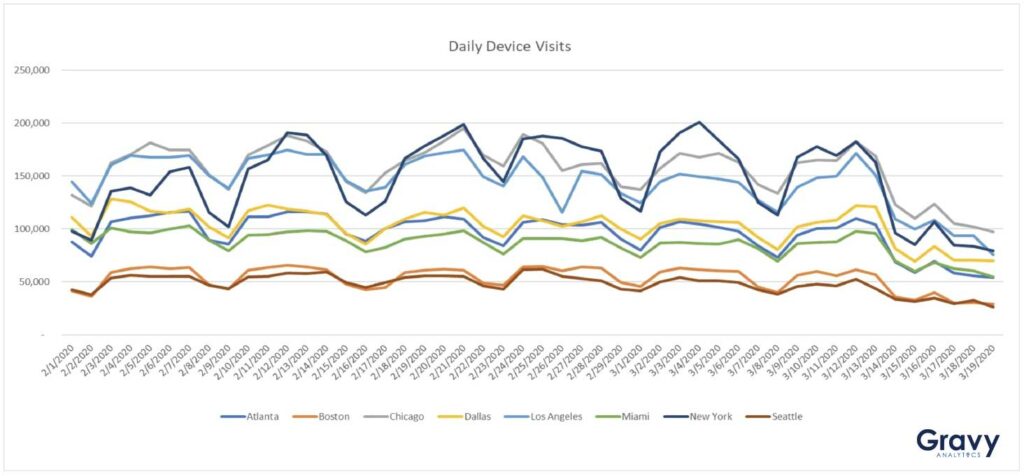
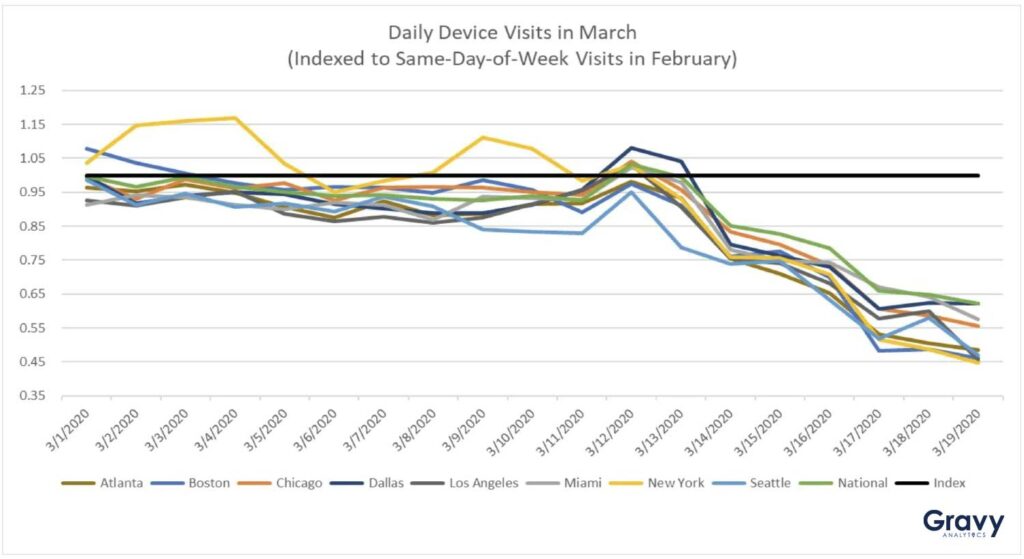
For this analysis, we looked at more than 198 million consumer visits observed between February 1 and March 19, 2020, at commercial locations in 7 major U.S. cities: Atlanta, Boston, Dallas, Los Angeles, Miami, New York, and Seattle. For ease of comparison, daily visitors to points of interest in March were indexed to average, same day-of-week visitors during the month of February.
This is what we learned:
Nationwide, the last day of normal consumer activity was Friday, March 13th. Thursday, March 12 had slightly higher than average foot traffic as people shopped for supplies for quarantine or isolation.
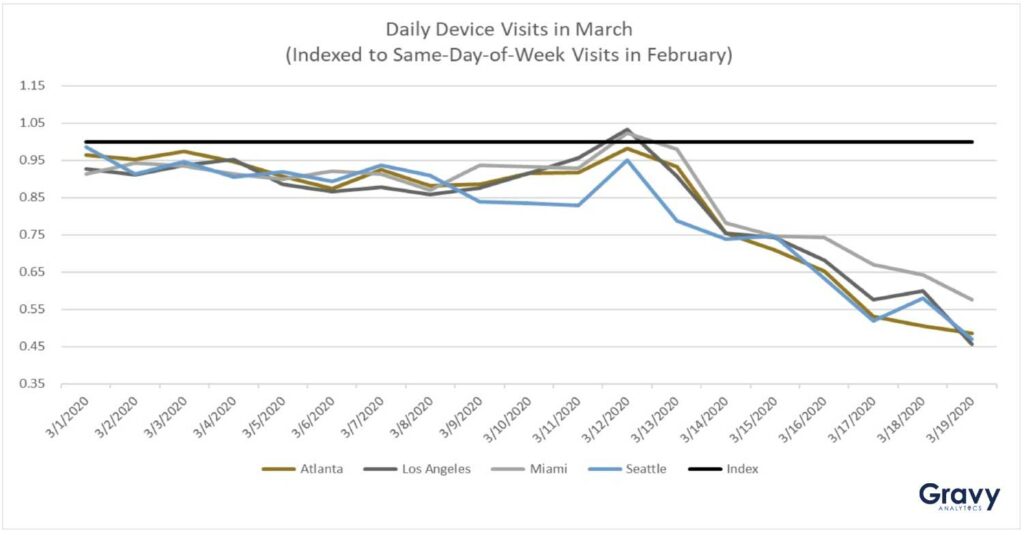
Atlanta, Los Angeles, Miami, and Seattle all saw below average daily foot traffic starting at the beginning of March.
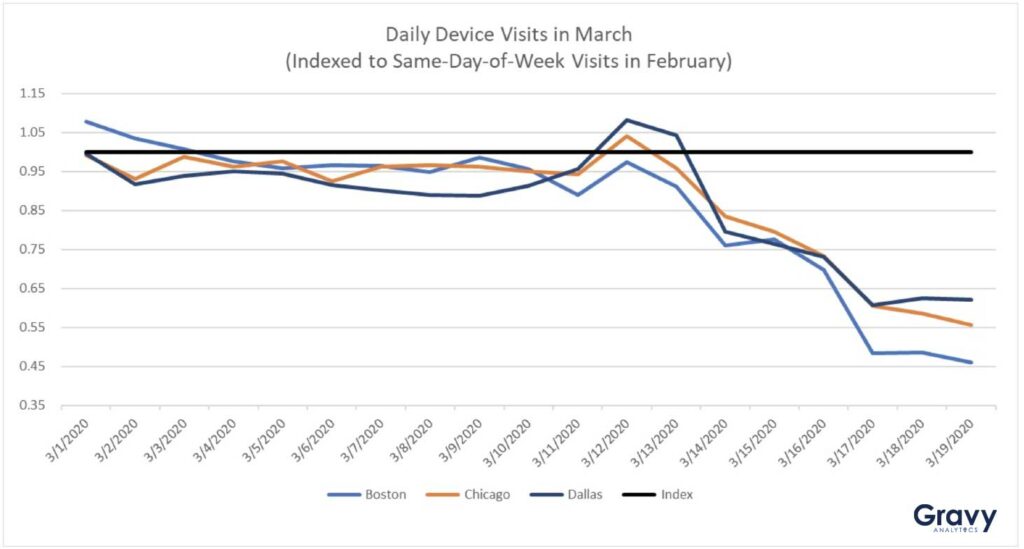
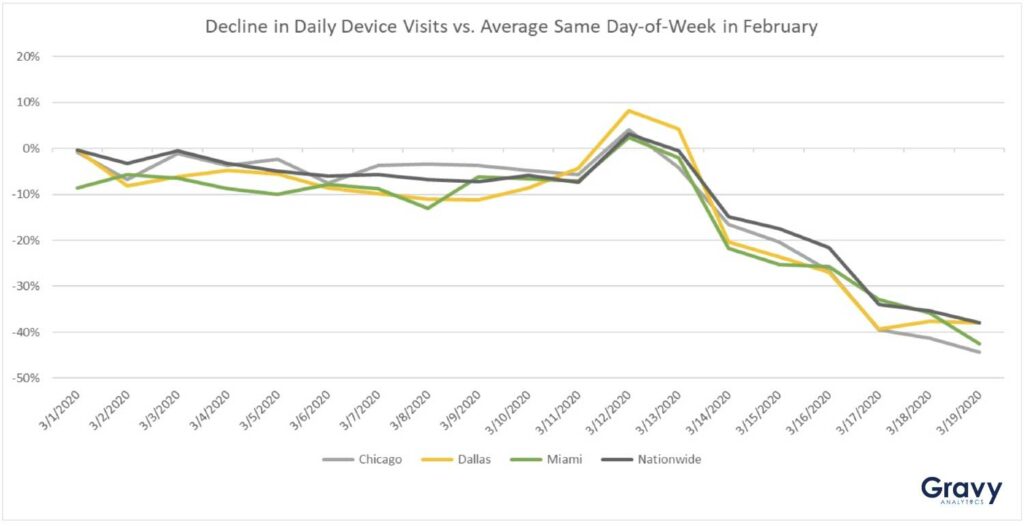
Boston, Chicago, and Dallas had slightly lower than average foot traffic in early March.
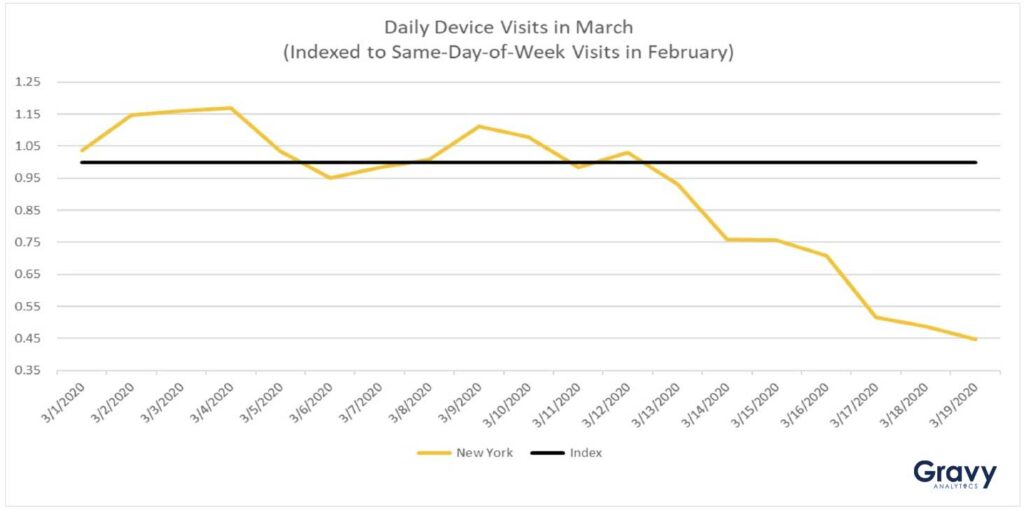
In contrast, New York City did not see a sustained drop-off in foot traffic until March 13.
Seattle continues to be a bellwether for foot traffic patterns in other major cities.
Seattle saw its first 15% day-over-day decline in foot traffic on March 9; similar declines did not happen in the other cities studied until March 14.
Seattle saw its first 20% day-over-day decline on March 13; similar declines did not happen nationwide until March 16.
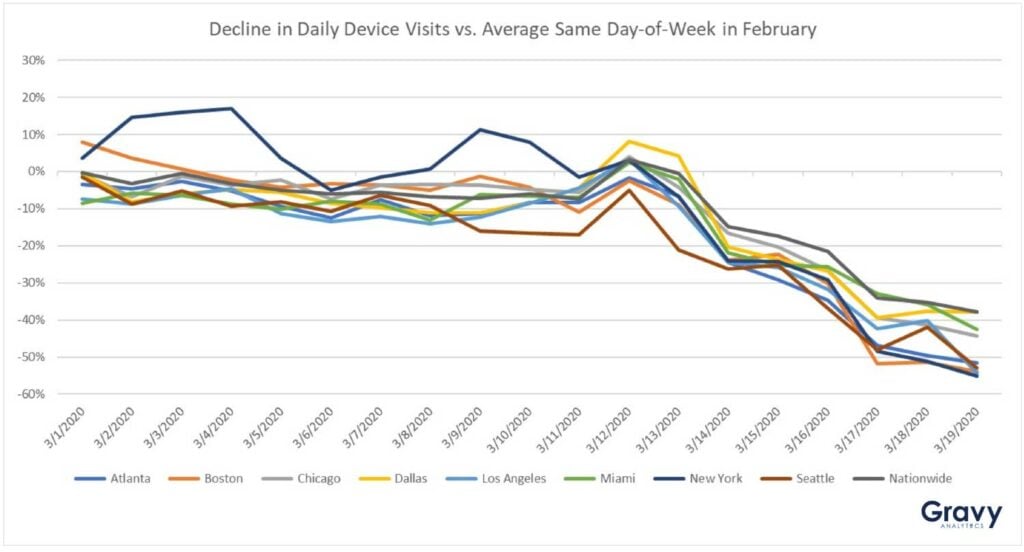
By 3/18, daily visitors to commercial places of interest declined by 35% nationwide.
Miami and Dallas saw the biggest single-day decline in foot traffic for any city. Visitors to points of interest on March 14 were 20% and 25% lower, respectively than on March 13.
Miami and Dallas saw the biggest single-day decline in foot traffic for any city. Visitors to points of interest on March 14 were 20% and 25% lower, respectively than on March 13.
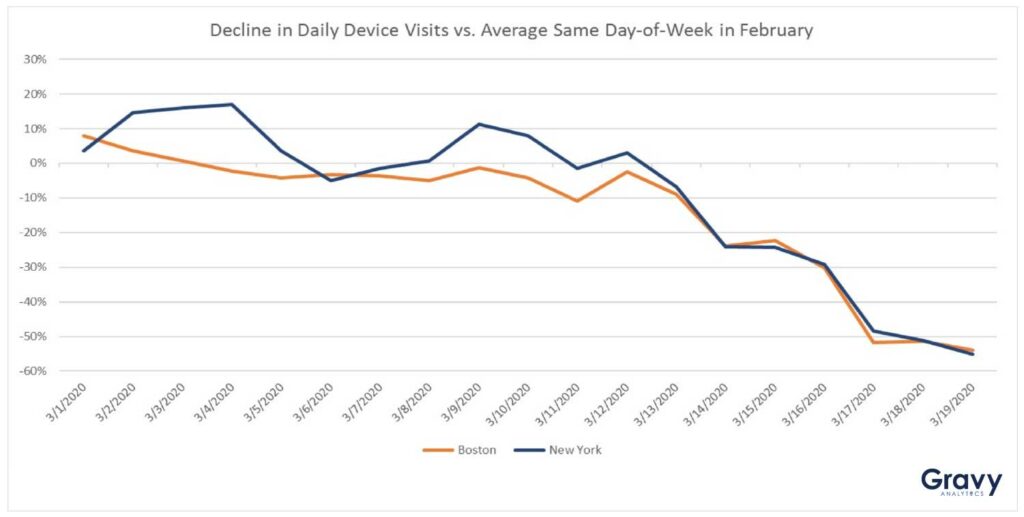
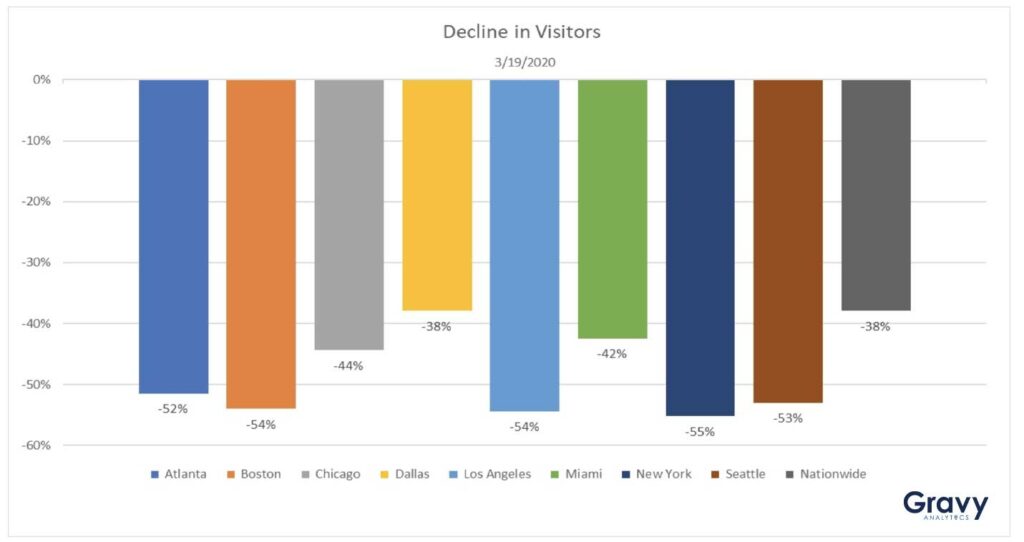
The single biggest decline in overall foot traffic happened in New York City. Foot traffic on Thursday, March 19 was 55% lower than the average Thursday in February.
How has your city responded to COVID-19 and social distancing, and how has your daily routine changed as a result? How could location data and location-derived insights help you adjust your business strategy in response to COVID-19? Sign up for our weekly newsletter for more ideas, or just let us know.