How COVID-19 and Social Distancing are Changing Consumer Behavior in U.S. Cities
April 10, 2020

The widespread practice of social distancing in response to COVID-19 is changing how U.S. consumers live their daily lives. Long-standing, typical foot traffic patterns no longer apply. When aggregated and analyzed, location data generated by consumer mobile devices can provide much-needed insight into these changes in consumer behavior – in near real-time – allowing us a glimpse into the impact of COVID-19 in cities across the U.S.
In the U.S., foot traffic to commercial places of interest in all place categories declined during March, with Entertainment and Nightlife most dramatically impacted. Gravy decided to take an in-depth look at category-level foot traffic for a selection of cities around the U.S. – Boston, New York, Seattle, Chicago, Dallas, Atlanta, Los Angeles, and Miami – to see how foot traffic patterns have changed in each.

To do so, we compared average daily foot traffic for March, with average same day-of-week foot traffic for February. Which cities’ residents are choosing to limit their shopping trips and dining at home? Which are the holdouts, and why?
Here is what we discovered:
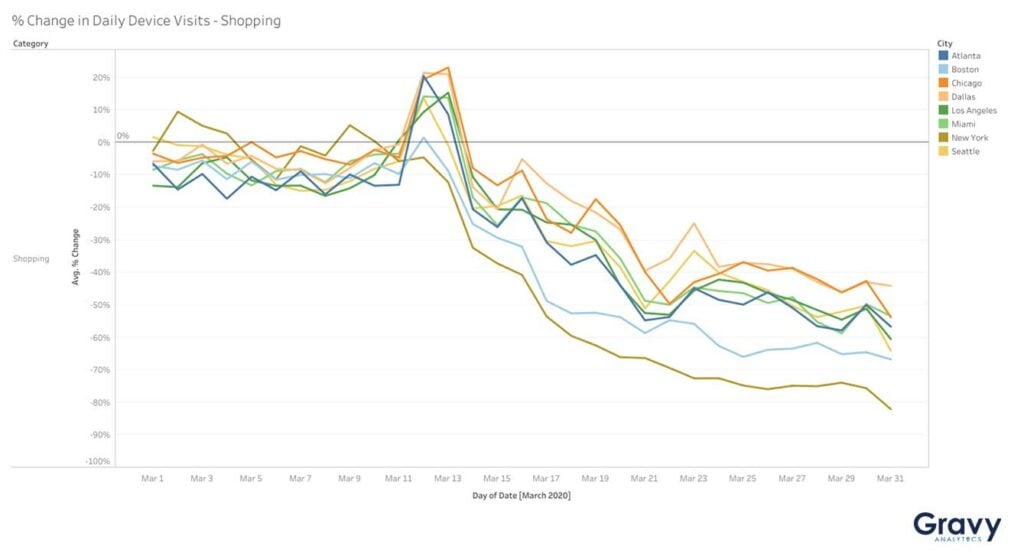
Shopping
New York City is one of the greatest shopping destinations in the world. At the beginning of March, daily device visits at New York shopping locations were higher, on average, than for all other cities. By March 9, however, New York residents began to stay at home and out of stores. As New Yorkers began to stay home, residents of other cities hit the stores, with daily device visits peaking on March 12 and 13. Since then, shopping foot traffic has declined in all cities – at first dramatically, and then more gradually through the end of March.
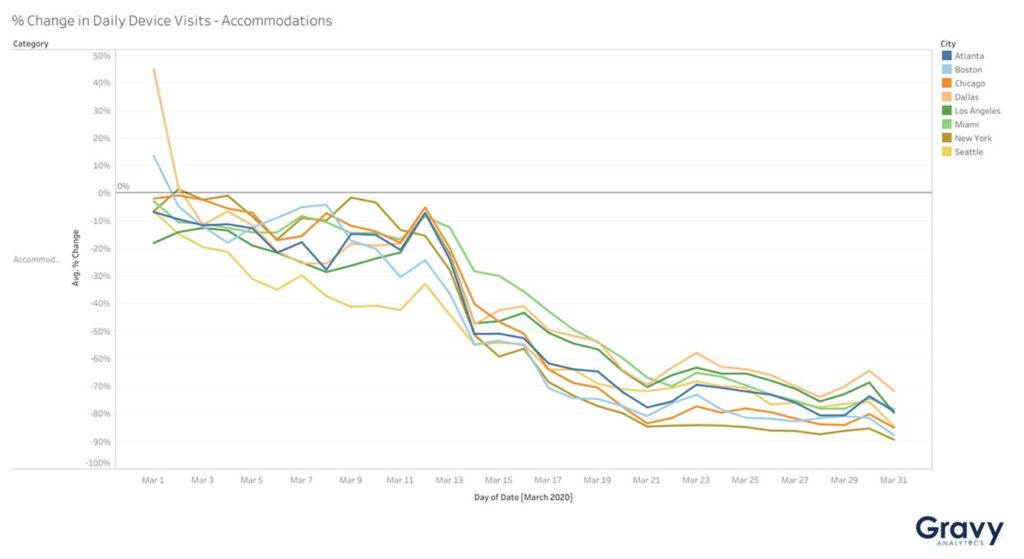
Accommodations
Dallas and Boston began March with higher-than-average daily device visits to Accommodations, like hotels and resorts. Seattle, one of the earliest hot spots for COVID-19, saw far lower than average daily device visits from the start of March. Note that foot traffic in all cities continued to decline through March 21, and visits remained relatively flat the rest of the month.
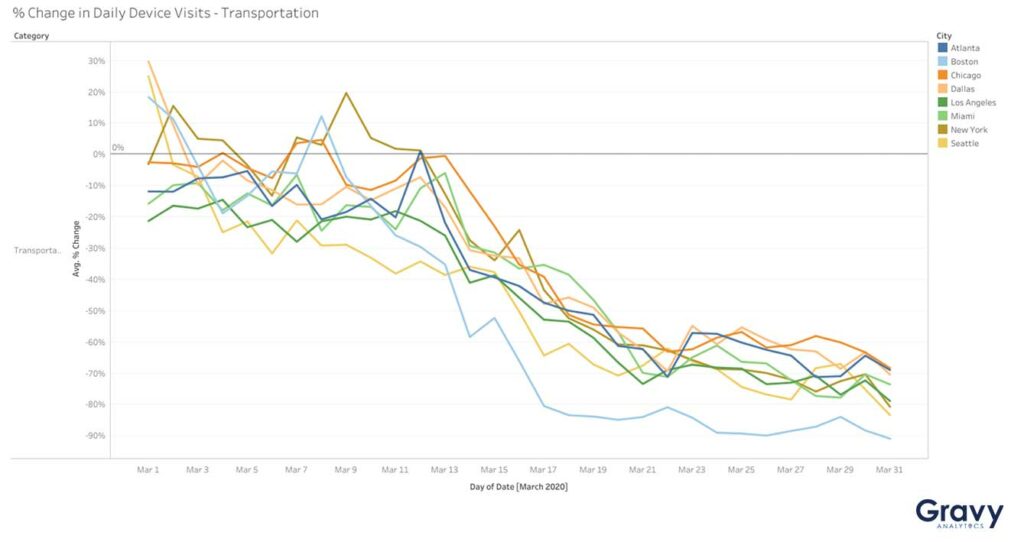
Transportation
Daily device visits to places in the category of Transportation were at their highest in early March. Foot traffic in Seattle fell below average as early as March 2 and continued to decline over the month. Daily device visits in Boston dropped rapidly after March 9, and by the end of the month, foot traffic had declined by nearly 90%. In Miami and Chicago, daily device visits did not start to slow until March 14.
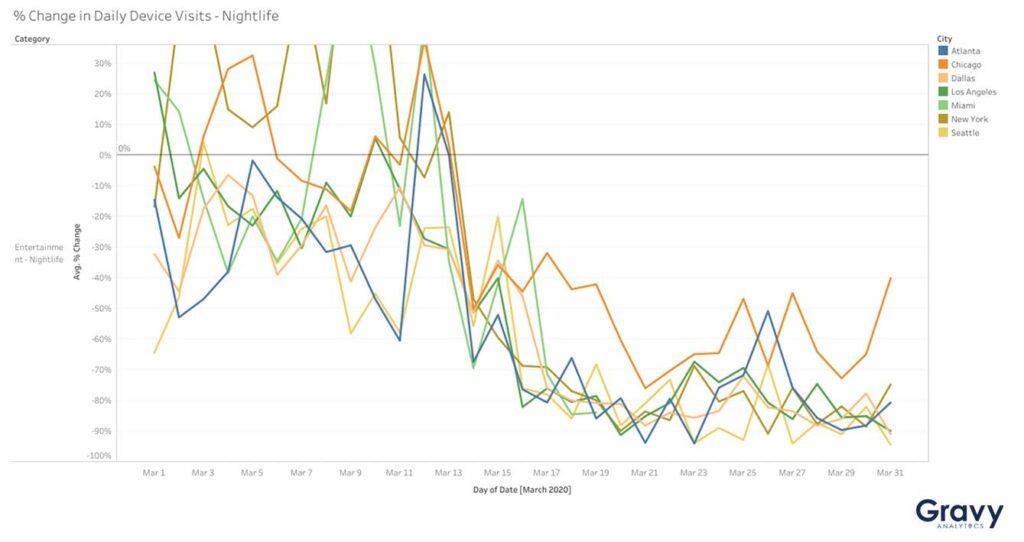
Entertainment – Nightlife
Miami, Chicago, and New York all started the month of March with much higher than average foot traffic in the category of Entertainment – Nightlife. By March 14, daily device visits were significantly lower for this category in all cities. Still, it seems that Chicago residents haven’t completely given up on going out.
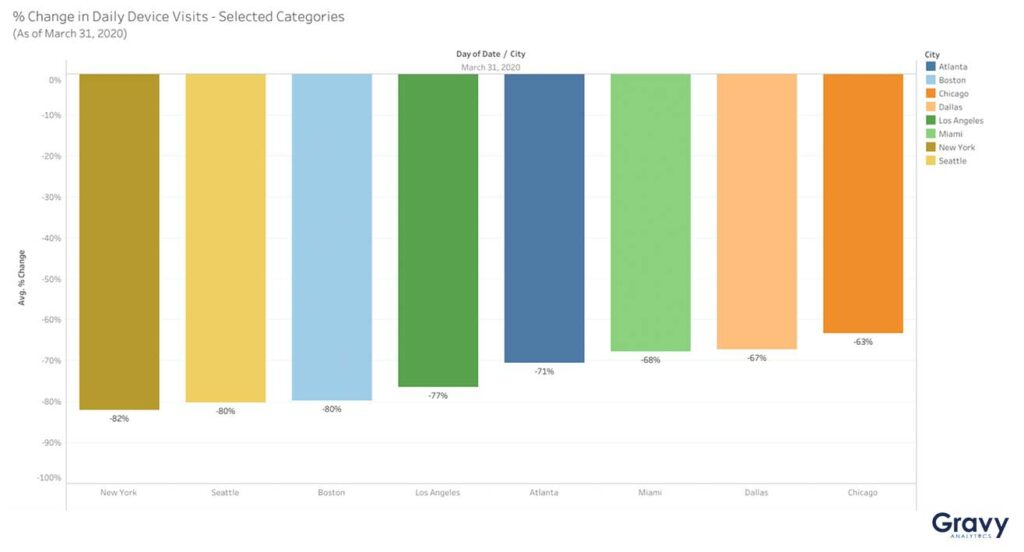
Major Foot Traffic Pattern Changes in New York City
Across all selected categories, New Yorkers made the most significant changes to their daily visit patterns, followed by residents of Seattle and Boston. Average daily device visits to commercial places of interest dropped by 82% as of March 31. While all cities experienced extraordinary declines in daily foot traffic during the period, those declines were less pronounced in Chicago, Dallas, and Miami.
How have your daily activities changed as a result of COVID-19? What could location intelligence tell you about social distancing, COVID-19, and how consumer behavior in cities across the U.S. continues to change? Sign up for our weekly newsletter for more ideas.