GRAVY PRODUCT INSIGHTS SERIES
Customer Loyalty Data Analytics with Location Intelligence
January 27, 2022

How has the coronavirus pandemic changed customer loyalty? In the past, understanding your customer’s interests involved studying how they engage with your website and social media content. Now, many businesses are looking for a more direct approach to determine how customer behavior has changed over time.
A leading indicator of customer loyalty and engagement is whether they actually visit your locations. Customer loyalty can be measured by how often customers visit your physical store locations, and how far they travel to those locations. With these insights from location intelligence, you can better understand the current needs of your most dedicated customers and improve strategic decision-making.

Data analysts have used Gravy Visitations and Trade Area datasets to understand customer loyalty and engagement to:
- Measure and compare the frequency of visits to different brand locations.
- Identify how far customers travel to visit those locations.
Let’s take a look at some real-world examples of how each of those Gravy data products can be used for customer loyalty analytics.
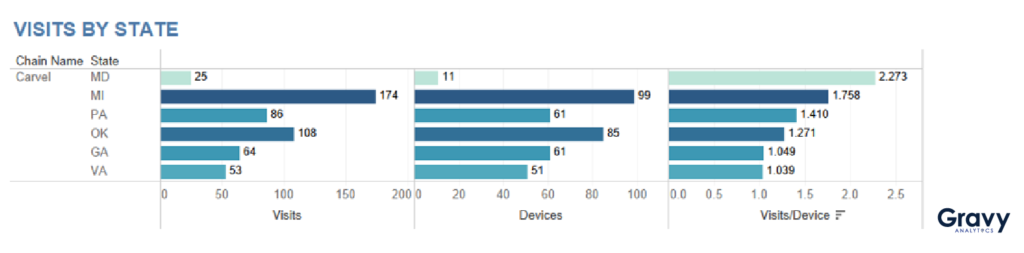
Frequency of Visits to Carvel
Carvel is a strong brand with a nostalgic customer base. If Carvel wanted to understand which states have their most loyal customers, they can use visit data to distill the number of visits and unique visitors to their stores down to a measure of average visit frequency by state. From this dataset, Carvel can learn that customers visit their stores most frequently in Maryland and Michigan. Gravy Visitations data also allows them to drill down even further to measure customer visit frequency rates by store.
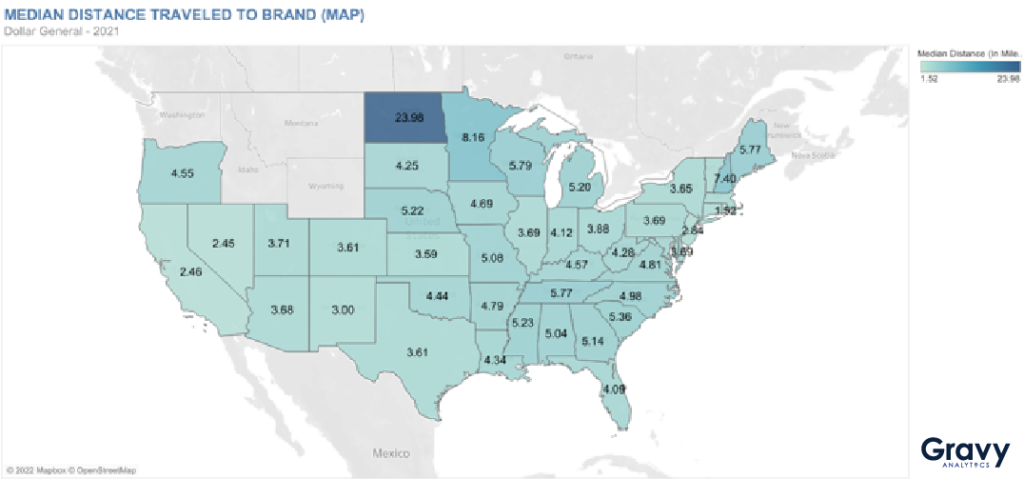
Distance Traveled to Dollar General
Next, we’ll look at how far customers travel to visit Dollar General stores. Gravy Trade Area data identifies the area of origin for each mobile device that visits a Dollar General. With that information, the company can calculate the median distance customers travel to visit their stores in each state. This tells Dollar General which sets of their stores have the most loyal customers who are willing to travel farther to engage with their brand.
Explore distance traveled for more leading brands in our interactive data dashboard.
How Carvel and Dollar General Can Use Insights from Customer Loyalty Datasets
What can these brands ultimately do with these insights post-analysis? The granularity of Gravy Visitations and Trade Area data enable both brands to look at indicators of customer loyalty by brand location or regional level to:
- Create custom segments of loyal customers and provide personalized offerings.
- Identify stores that need a marketing boost to enhance loyalty programs.
- Discover opportunities for business expansion based on areas with high customer demand.
For more information on Gravy Visitations and Trade Area Data, speak with a location intelligence expert from Gravy Analytics today.