The Gas Shortage Through the Lens of Location Intelligence
July 6, 2021

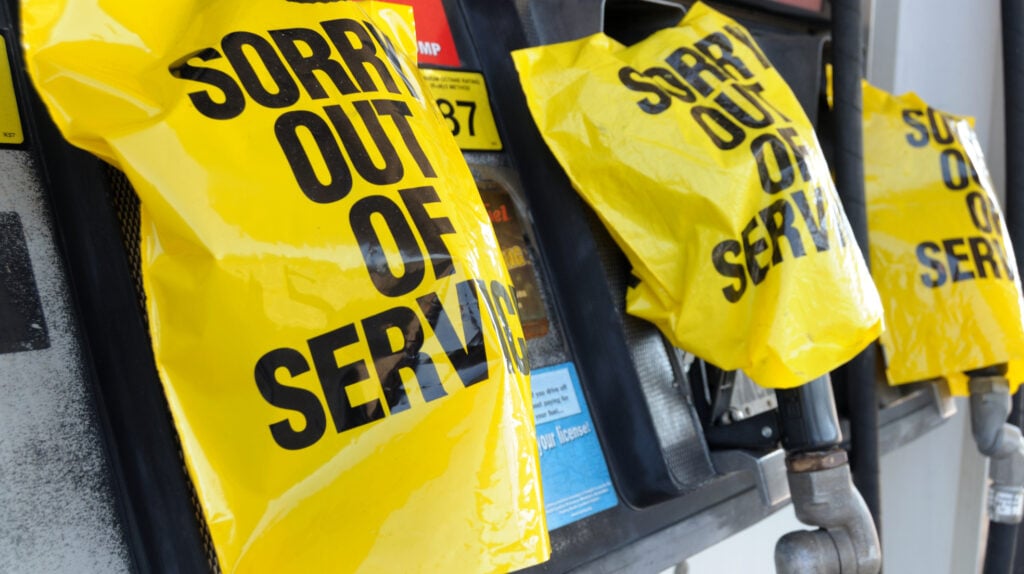
On May 7th, 2021, the Colonial Pipeline was hit by a cyberattack that resulted in a gas shortage for much of the East Coast. The Houston-based company is an American oil pipeline system that serves as a major supplier of gas for a large part of the United States. In the days following the attack, many consumers were hard-pressed to find a gas station that didn’t have a line wrapped around the block. The cyberattack prompted consumers to fill up their tanks and even stockpile reserves—behavior that drove gas prices up and caused gas shortages in some states.
In this article, we’re going to explore the 2021 gas shortage through the lens of consumer foot traffic data. Which states were the most affected (and which ones weren’t)? Where did panic buying behavior take hold?
Before the Fuel Crisis
To truly understand the impact of the gas crisis in May, it’s important to look at consumer foot traffic before the shortage began. What does gas station foot traffic look like under ordinary conditions?
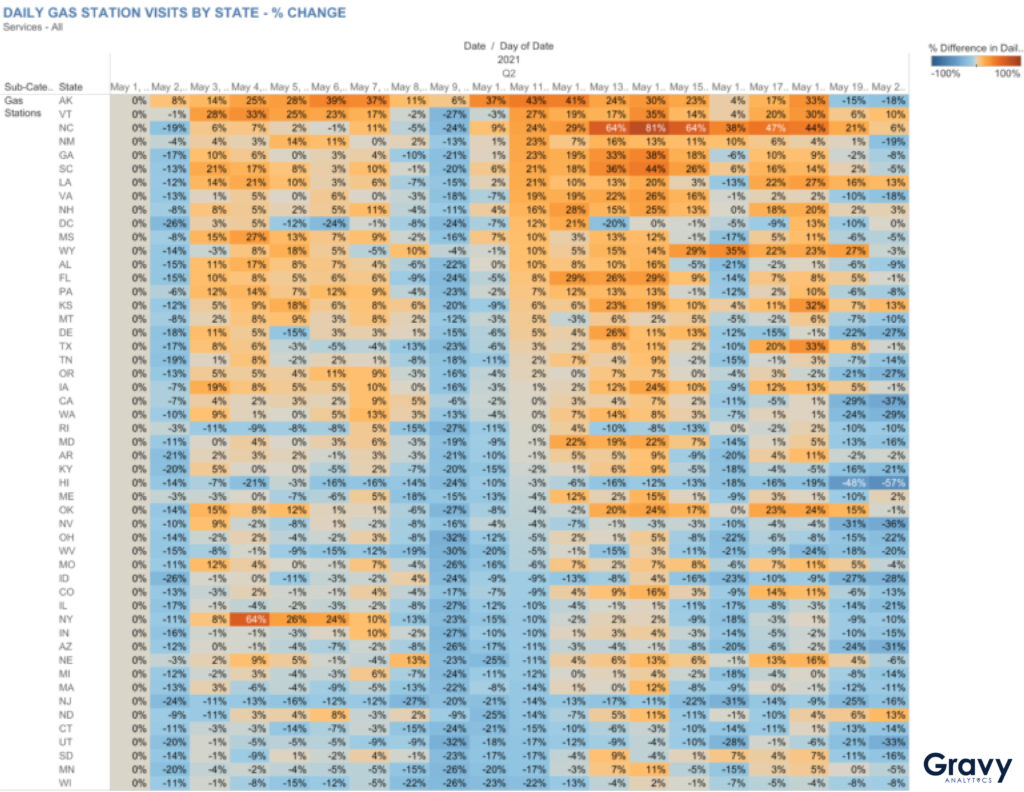
On any given day, gas station foot traffic varies, with more visits typically occurring on weekdays than on weekends. Following the Federal Motor Carrier Safety Administration’s regional emergency declaration on May 9, 2021, however, gas station visit patterns began to change. By May 11, gas station visits had jumped dramatically in several states, including Alaska, Vermont, North Carolina, and New Mexico. Interestingly, only North Carolina was among the states served by the pipeline.
Over the following days, foot traffic to gas stations increased in more states served by the pipeline, including Florida, Georgia, and South Carolina, as well as in states like New Hampshire and Oklahoma that should have been unaffected by the cyberattack. What might have caused consumers in some states to overreact? It could have been determined by the extent to which customers in those states rely on automobiles for transportation. Neither New Hampshire nor Wyoming has massive metropolitan centers where public transportation is readily available.
The Day of the Shortage and its Aftermath
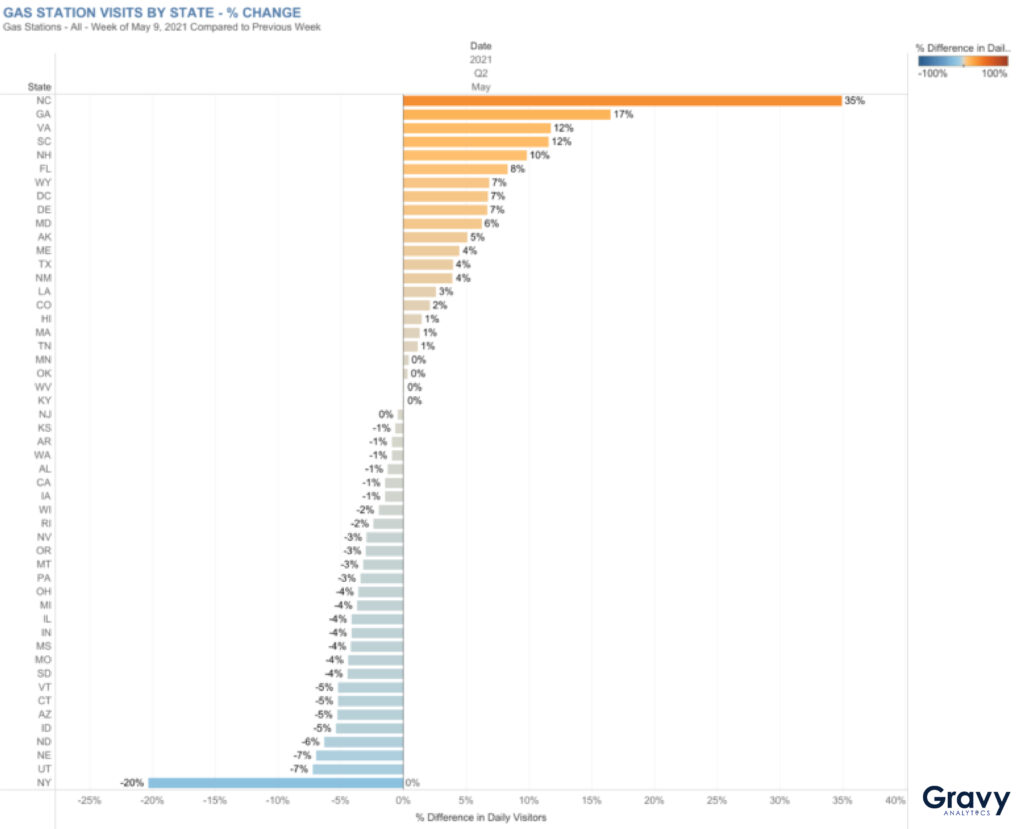
North Carolina was the most impacted state by the gas shortage: foot traffic at gas stations peaked at 81% higher on May 14, compared to May 1. For the week of May 9, 2021, foot traffic to gas stations in North Carolina was 35% higher compared to the previous week. Georgia (+17%), Virginia (+12%), and South Carolina (+12%) were right behind North Carolina in terms of demand for that same week.
Although much of the East Coast was expected to be impacted by the gas shortage, some states outside of the Southeast saw lower than usual foot traffic at gas stations. For example, foot traffic to gas stations in New York during the week of the attack was 20% lower compared to the previous week. New York state residents might have avoided gas stations knowing that their neighbors just to the south, New Jersey and Pennsylvania, were waiting in long lines for fuel. Other Northeast states, including Vermont and Connecticut, also saw lower consumer demand for gas.
The Future of Gas Demand
With more consumers starting to travel again following lengthy lockdowns, we expect consumer demand for gas will continue to increase. Even as vaccination rates grow, more people will continue to prefer traveling via personal vehicles for the foreseeable future. For now, people who have the option to do so will continue to social distance while traveling and avoid public transportation—even if it means paying a bit more and occasionally waiting in a long line for gas. For more information on how to use location intelligence for economic forecasting, contact us today.