Gas Station Foot Traffic Slows Nationwide During Q1 2022
June 22, 2021

In May 2022, the inflation rate rose to 8.6% and gas prices rose 3.9% compared to the previous month. Mass transit fares have risen due to inflation and other factors, such as the increase in costs associated with maintenance. Even before the surge in mass transit fares, transportation agencies saw a big decline in ridership during the coronavirus pandemic and offered reduced fares (or even free passes). Despite price hikes, some forms of public transportation, including airports and trains, are expecting more passengers due to summer travel. Still, many consumers aren’t ready to completely abandon their private vehicles in favor of mass transit. To understand how inflation is affecting different modes of transportation, we analyzed foot traffic to bus stations, gas stations, public parking lots, and train stations to determine if consumers are reconsidering how they travel.
Gas Station Foot Traffic Slows Nationwide
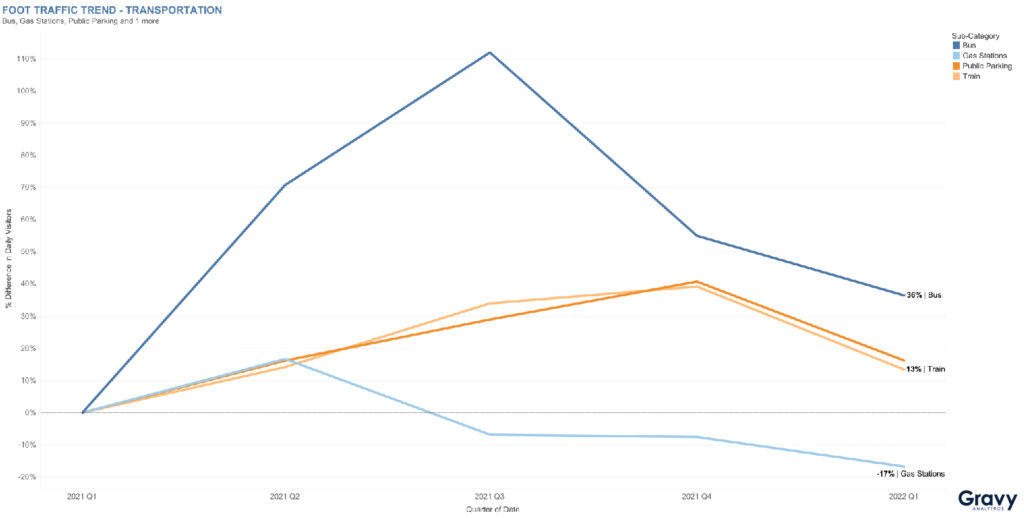
Foot traffic to bus stations increased significantly, compared to Q1 2021, peaking in Q3, and then decreasing into 2022. In Q1 2022, bus station foot traffic was 36% higher, compared to the same quarter in the previous year. As we mentioned previously, transit agencies provided riders with reduced fares, and these initiatives could have caused consumers to trade in their car keys for metro passes. Trains and public parking locations saw a similar trajectory in foot traffic; both saw visits peak in Q4 2021. In Q3 2021, visits to public parking spaces were slightly higher, but train station visits surpassed public parking locations by Q4 2021. These trends indicate consumer interest in returning to travel, whether by train or car. Both trains and parking lots, like garages (where consumers pay a fee to store their cars) and commuter lots, saw consumer activity drop after Q4 2021. By Q1 2022, train station foot traffic was just 13% higher compared to the first quarter of the previous year, while public parking lot foot traffic was 16% higher. Visits to gas stations peaked in Q2 2021, but foot traffic then declined and remained below Q1 2021 levels for the rest of the year and into 2022. Gas station foot traffic reached its lowest point in Q1 2022; this 17% decline in traffic may reflect higher prices at the gas pump.
Regional Transportation Trends
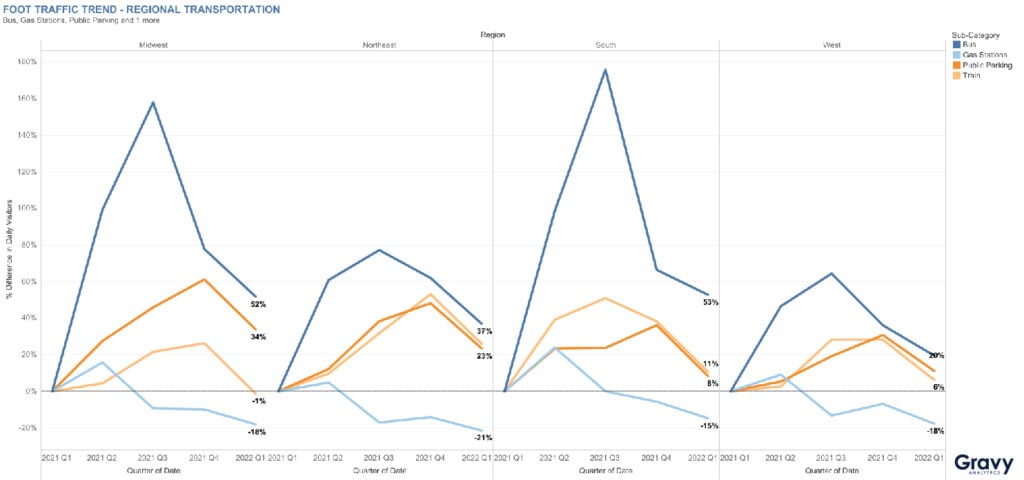
Transportation trends vary by region. While foot traffic to bus stations was up year-over-year in all regions, the most dramatic increases happened in the Midwest and South. Visits to public parking locations increased the most in the Midwest and Northeast, while visits to train stations grew most dramatically in the Northeast and South. Gas station visits were down across the U.S., but especially so in the Northeast. In Q1 2022, foot traffic to gas stations in the Northeast was 21% lower, compared to Q1 of the previous year. The South saw a decline of 15%, and the Midwest and West experienced declines of 18% over the same time period.
How Transit Agencies Can Use This Data?
Gas station visits are slowing down, which means consumers are more than likely in the market for alternative transportation. This is an opportunity for transit agencies to create data-driven programs by using this data to understand what modes of transportation interest consumers the most and least. For example, an agency located in the Midwest might choose to put more funding toward buses and public parking, and create a data-driven plan to encourage consumers to travel more via train. Interested in more information on foot traffic data use cases? Contact one of our location intelligence experts today.