How Investors Can Use Location Data to Understand Company Performance
May 14, 2020

Location data, pseudonymous mobile location signals, and the insights it provides can be used to understand company performance. By analyzing foot traffic for a business and its category, it is possible to compare its patterns against its competitors in the category. Foot traffic data provides information about the number of customers a business serves, and how they interact with that business. Investors and investment banks may find this data informative when deciding whether or not to invest in a company, or when conducting financial modeling.
Other business performance metrics that can be derived from location data include the days of the week or times of days when foot traffic is at its peak. Analysts can also use dwell time, or the amount of time a mobile device is observed at a place or location, as a measure of consumer engagement. Generally speaking, when dwell time is longer, consumers are more engaged with the business and are more likely to have made a purchase while there.

Competitive Analysis of Texas Roadhouse
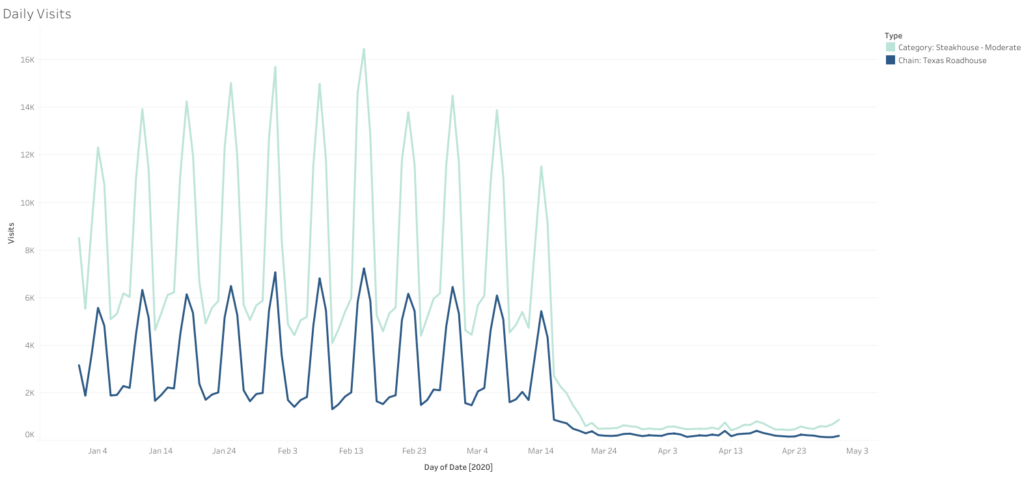
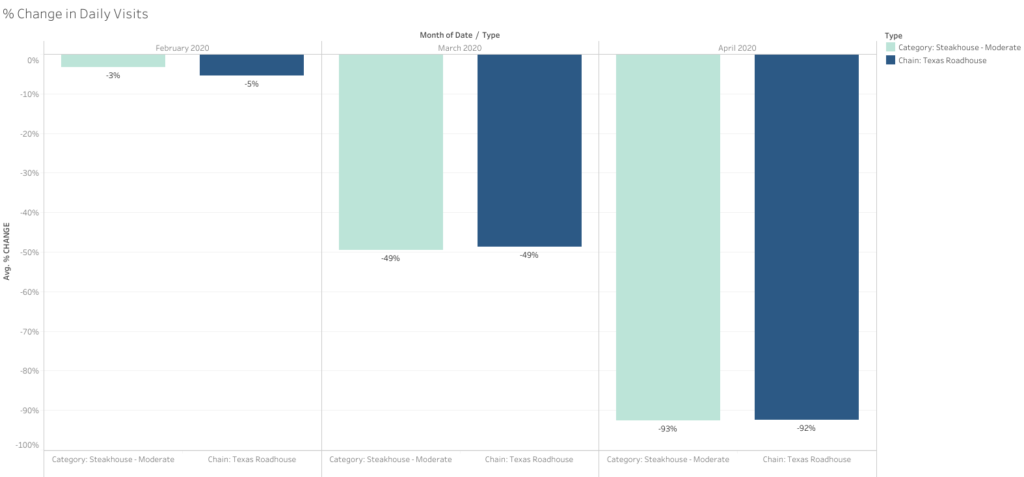
Consider this chart below which illustrates foot traffic at Texas Roadhouse and for the Steakhouse – Moderate category between January 1 and April 30, 2020.
At a glance, Texas Roadhouse performed fairly consistently with other steakhouses in the Steakhouse – Moderate category. In February, both had slightly lower than average, same-day-of-week foot traffic than in the month of January. Note that daily foot traffic in the category reached its peak over Valentine’s Day weekend — to be expected as couples went out to dinner to celebrate.
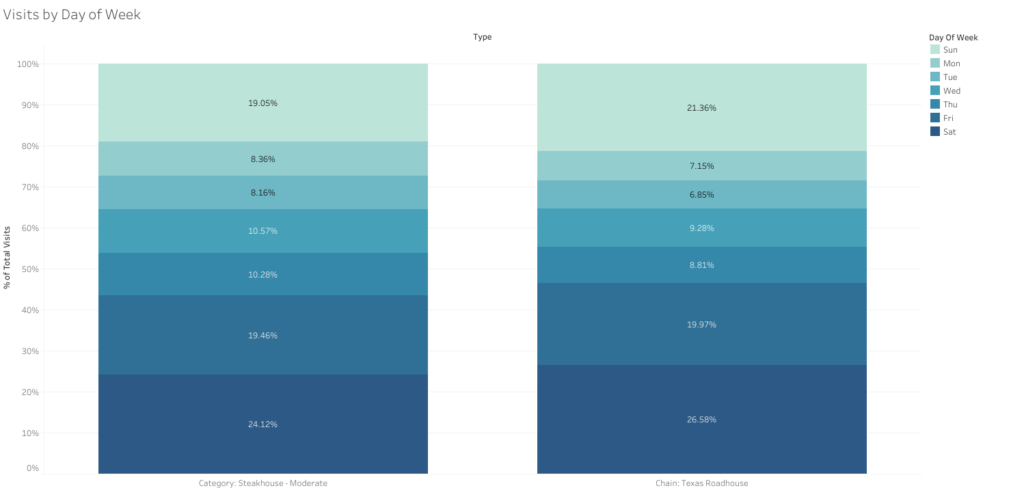
Texas Roadhouse sees more of their foot traffic on weekends – Friday, Saturday, and Sunday – with other moderate steakhouses serving more customers on weekdays. While the data we reviewed was not segmented by time-of-day, this points to other steakhouses in the category attracting more weekday dinner takeout traffic than Texas Roadhouse, in general.
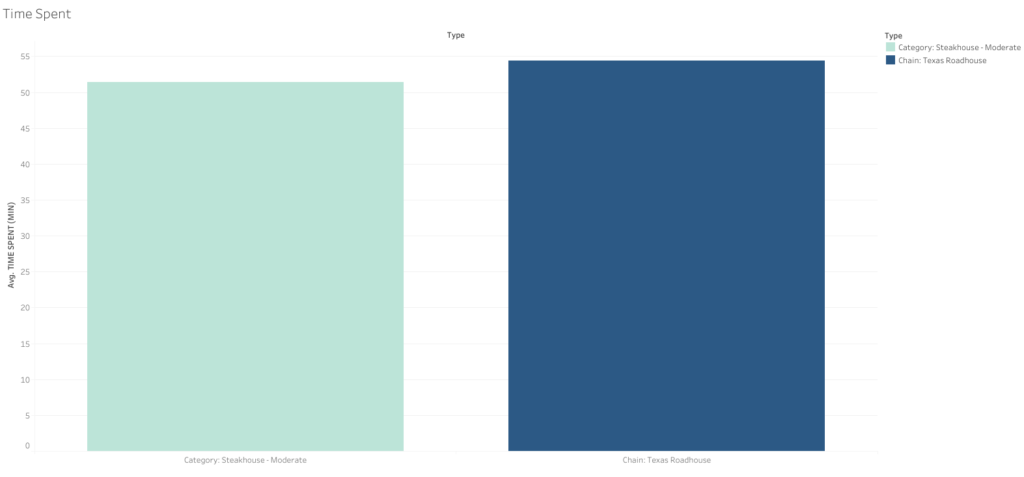
Texas Roadhouses also have slightly longer than average dwell time than steakhouses in its category. This suggests that Texas Roadhouse does more of its business when customers are more likely to enjoy a leisurely meal — during evenings or weekends. Or, perhaps Texas Roadhouse is less efficient at turning over tables, and could optimize its services in order to serve a few more customers during dining hours.
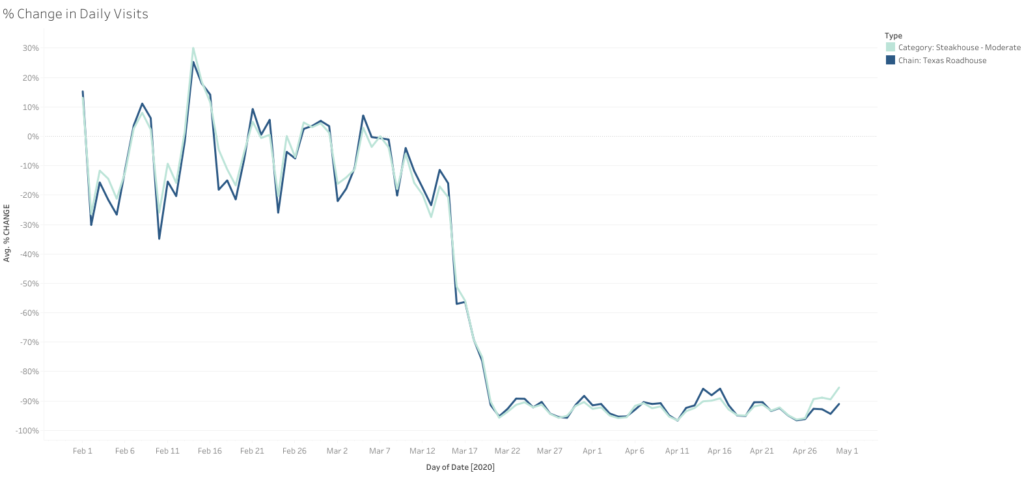
During the period, Texas Roadhouse performed very consistently with its segment. In March, average daily foot traffic had decreased by 49% at both Texas Roadhouse and across the category. By the end of April, Texas Roadhouse’s average daily restaurant foot traffic had decreased by 92%, almost identical to the 93% decline in foot traffic experienced by the category as a whole.
Gain New Insights with Location Analytics
Location analytics provide a privacy-friendly way to measure company performance – or in this case restaurant performance – by providing useful insight into consumer foot traffic pattern data for a brand. While foot traffic is clearly not the only measure of a company’s success, it can serve as a useful proxy for consumer demand for and engagement with a brand, and sales of associated products or services.