Human Mobility Data Shows How the U.S. Population Moved During the COVID-19 Pandemic
June 29, 2022

Human population movements are often prompted by major events. In 2020, how and where we work were changed by the coronavirus pandemic. For many, work no longer limited where they could live within the U.S. This shift caused people to reconsider where they live. The housing market became hot for both buyers and sellers as mortgage prices reached record lows in 2020. However, in 2022, the housing market is starting to cool, which means more potential buyers may be choosing to rent rather than purchase.

Despite this current fluctuation in the market, the demand for housing is only going to continue in the next couple of years, especially if inventory becomes low while demand remains high. This leads us to important socioeconomic questions: How have populations changed throughout the pandemic? And, are consumers still moving in 2022? If so, what areas are people moving to and away from?
To understand this, we examined how population distribution in the U.S. has changed within the last two years, by comparing human mobility data from Q1 2020 and Q1 2022 to see which counties have lost and gained the most residents since the start of the pandemic.
Suburbs Over Metropolitan Areas
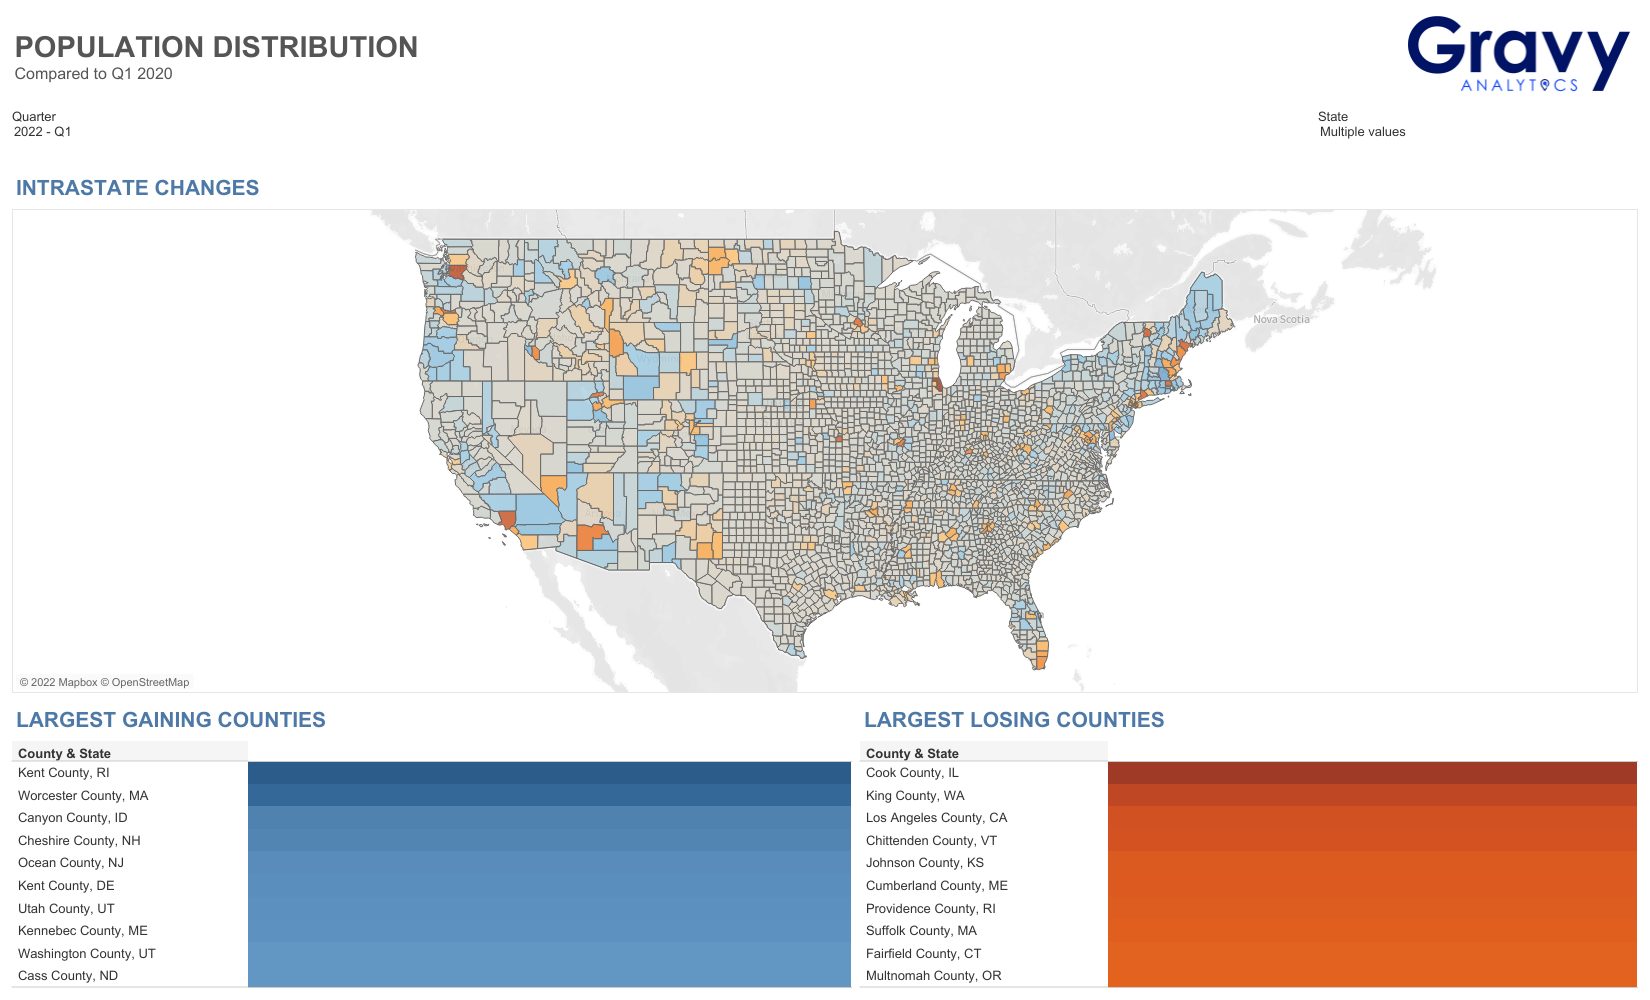
Let’s first take a look at the U.S. as a whole. The overall population movement trends across the U.S. show that consumers are moving away from counties known for big metropolitan areas and heading for ones in the suburbs.
The county that gained the most population is Kent County, Rhode Island. Kent County is known for the towns of Warwick, West Warwick, East Greenwich, Coventry, and West Greenwich. Kent County has the lowest cost of living compared to other counties in Rhode Island and is in close proximity to Providence and Boston, which might have made it appealing for people moving to the area.
Here are the top 10 counties in the U.S. that have gained the most population since the start of the pandemic:
- Kent County, RI
- Worcester County, MA
- Canyon County, ID
- Cheshire County, NH
- Ocean County, NJ
- Kent County, DE
- Utah County, UT
- Kennebec County, ME
- Washington County, UT
- Cass County, ND
The county that lost the most population is Cook County, Illinois. Chicago and its metro area make up Cook County. In 2021, Chicago saw more residents move than any other city in the United States. Why are people leaving Chicago? Many left due to the high cost of living and high tax rates.
Here are the counties in the U.S. that have lost the most population:
- Cook County, IL
- King County, WA
- Los Angeles County, CA
- Chittenden County, VT
- Johnson County, KS
- Cumberland County, ME
- Providence County, RI
- Suffolk County, MA
- Fairfield County, CT
- Multnomah County, OR
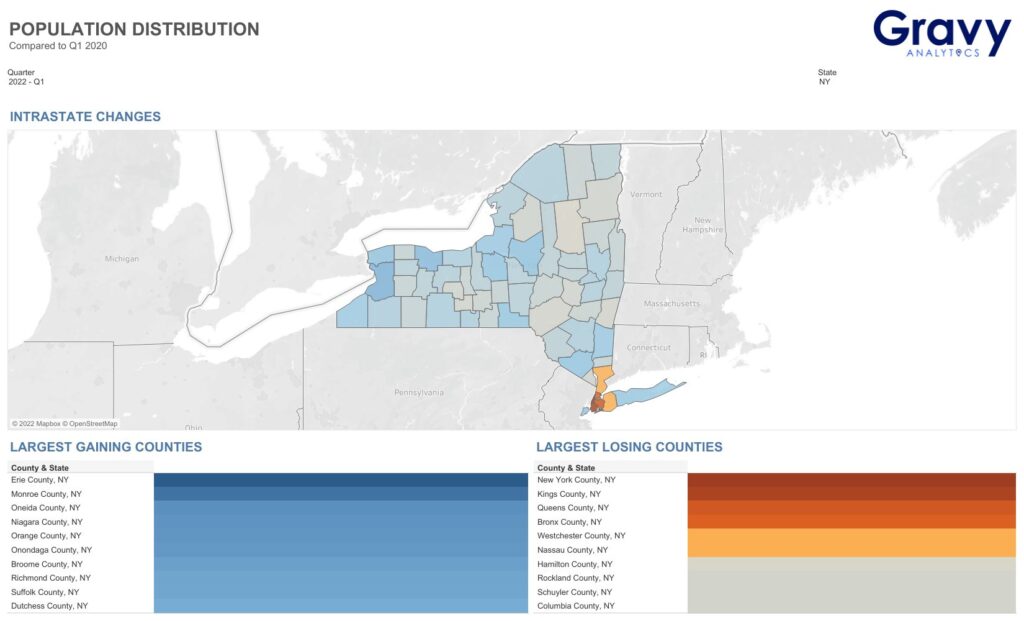
New Yorkers Moved Upstate
Erie County gained the most population out of all the counties in New York state. Recently, the county’s population increased for the first time in 70 years. Affordable housing is a major factor in Erie County’s population growth. Another reason for Erie County’s boost in population could be New Yorkers moving from the big city to upstate New York.
Here are the top counties in New York that gained the most population:
- Erie County, NY
- Monroe County, NY
- Oneida County, NY
- Niagara County, NY
- Orange County, NY
Which counties in New York lost the most population? New York County has the largest population loss compared to other counties. New York County includes Lower Manhattan, Harlem, Upper Manhattan, Washington Heights, and Fort George in New York City. New York City is one of the major U.S. cities that lost a large amount of its population early on during the pandemic. Based on our data, we predict that New York County will see its population stagnate during the next couple of years due to the high cost of living in Manhattan.
The counties in New York that lost the most population include:
- New York County, NY
- Kings County, NY
- Queens County, NY
- Bronx County, NY
- Westchester County, NY
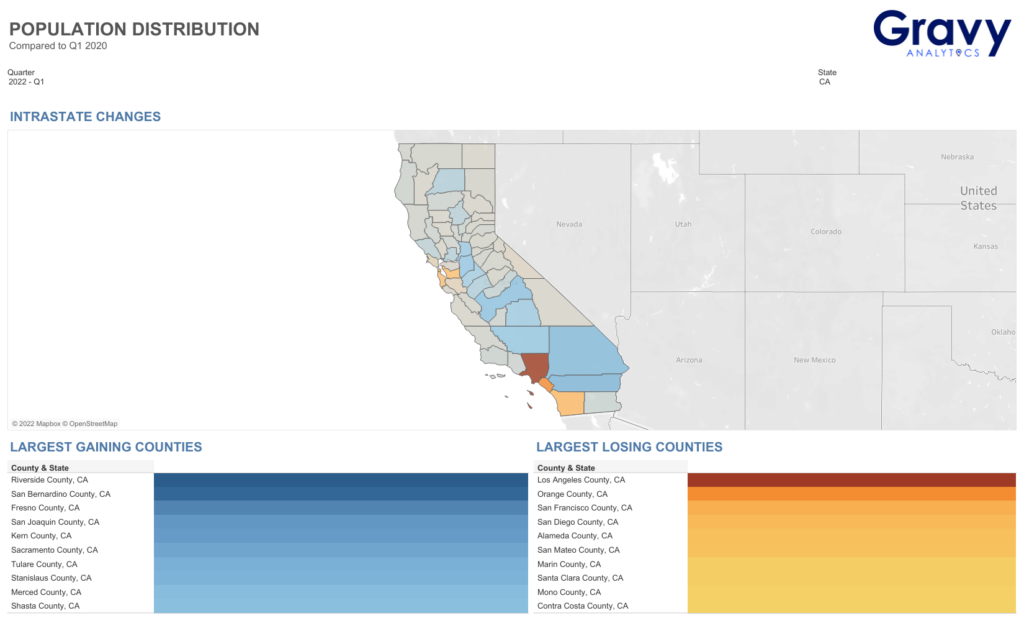
Goodbye L.A., Hello Inland Empire
Riverside County, often referred to as the Inland Empire, had the largest gain in population compared to other California counties. Who is moving to Riverside County? At the beginning of the pandemic, former L.A. residents moved to cities and towns within Riverside County. This trend is more than likely going to continue as many Californians move away from the coast.
Here are the top five counties that saw significant gains in population:
- Riverside County, CA
- San Bernardino County, CA
- Fresno County, CA
- San Joaquin County, CA
- Kern County, CA
Los Angeles County lost the most population out of all the counties in California. The county’s most populous city is Los Angeles. L.A.’s rising home prices have caused many to relocate to places that are more affordable.
The top counties that lost the most population are all close to California’s coast. These counties include the following:
- Los Angeles County, CA
- Orange County, CA
- San Francisco County, CA
- San Diego County, CA
- Alameda County, CA
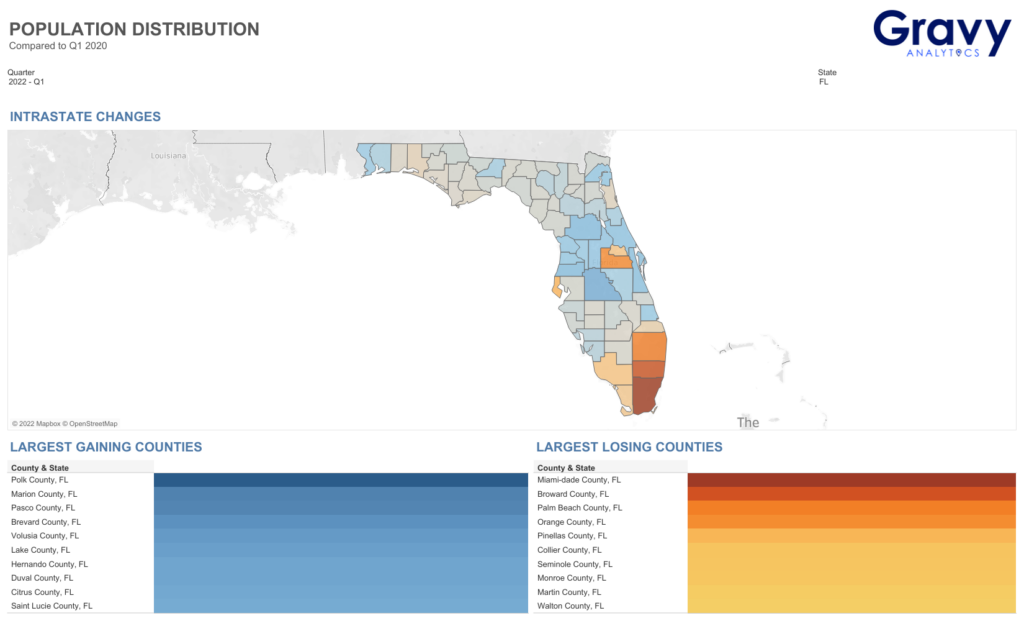
Moving from Miami to Central Florida
Polk County had the largest population growth compared to other Florida counties. This county is located between two big metropolitan areas: Tampa and Orlando. Along with its central location, Polk County has the advantage of a diverse economy that doesn’t completely rely on tourism like other counties in the Sunshine State. Employment opportunities are a big reason why many people move to new areas and Polk County’s diverse economy could be driving its population growth.
Florida counties that gained the most population include:
- Polk County, FL
- Marion County, FL
- Pasco County, FL
- Brevard County, FL
- Volusia County, FL
Miami-Dade County had the most population loss compared to other counties within Florida. Miami is the most populated city in the county, but why are people moving away? The cost of living in Miami has significantly increased, and many can no longer afford to live there. Based on our data, we predict that Miami’s population growth will stagnate until the city finds a way to make housing more affordable for locals and new residents.
Here are the top Florida counties that lost the most population:
- Miami-Dade County, FL
- Broward County, FL
- Palm Beach County, FL
- Orange County, FL
- Pinellas County, FL
The Importance of Human Mobility Data in Population Studies
As we continue to deal with changes in the economy and environment, it’s going to be important for organizations to use human mobility data to understand how populations shift over time. When an area’s population grows, the need for housing and other services also increases. Without data like location intelligence, it becomes difficult for municipalities to identify where services are needed the most. But, data shouldn’t just be used to understand population growth, it should also be used to determine what areas are experiencing population declines and help researchers get insights into why populations are shifting in specific locations. For more information on how your organization can use human mobility insights, connect with one of our location intelligence experts today.