Q3 2021 Customer Loyalty Trends Part 2: Place Categories Analysis
January 3, 2022

Customer loyalty insights are important for businesses looking to increase retention and acquisition. The first part of our data analysis revealed that some place categories are seeing more infrequent, occasional customers. In part two of our analysis, we are taking a look at some very different categories, like Outdoors & Recreation, Services, Shopping, and Transportation, to compare the percentage of visitors who return within 7 days, 30 days, 3 months, and 6 months, and how each has changed since 2019.

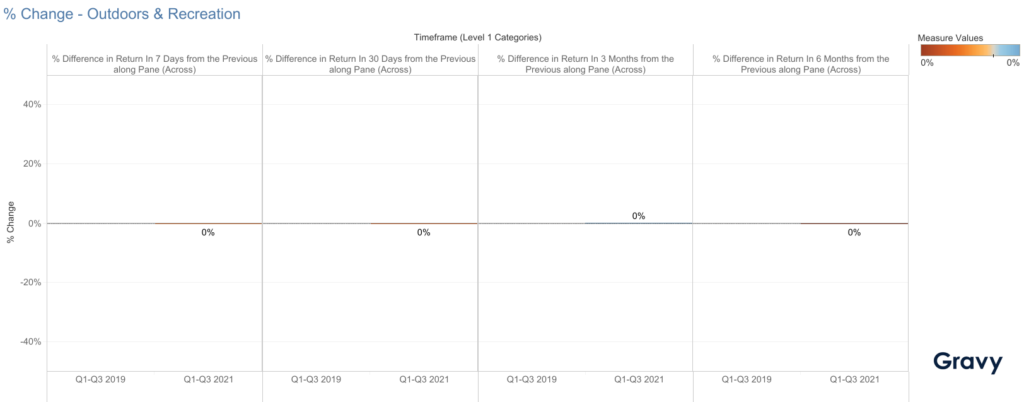
Outdoors & Recreation
In 2021, there was no significant difference in return visitors to parks and other recreation areas than in 2019. Consumers continued to go back to their favorite outdoor spots on a regular basis. This consumer trend took off during coronavirus lockdowns as parks, hiking trails, and other outdoor spots emerged as go-to locations for social distancing.
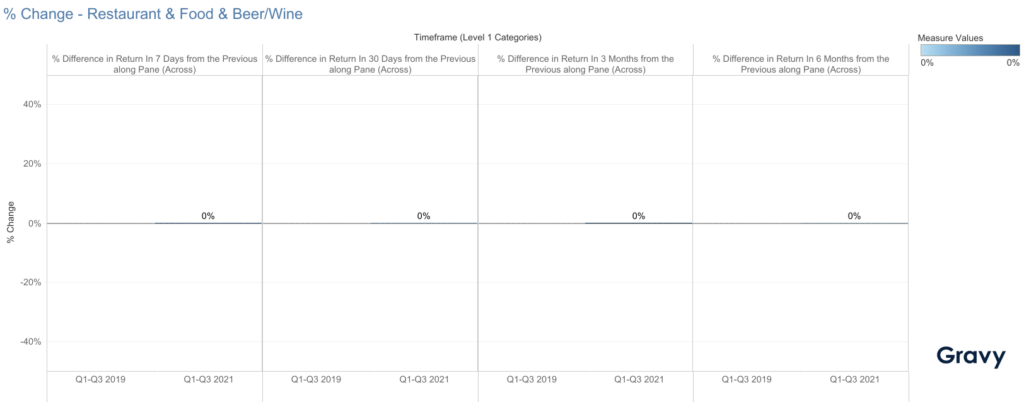
Restaurant & Food & Beer/Wine
In 2021, the percentage of return visitors in the Restaurants & Food & Beer/Wine category was also virtually identical to 2019. What does this mean for restaurants, grocery stores, and c-stores? Consumers still need to eat and – while they may be getting takeout instead of sitting down to fine dining – are still making time in their new routines to pick up donuts, shop for groceries, grab a snack at the drive-thru, or return to other locations in the Restaurant & Food category.
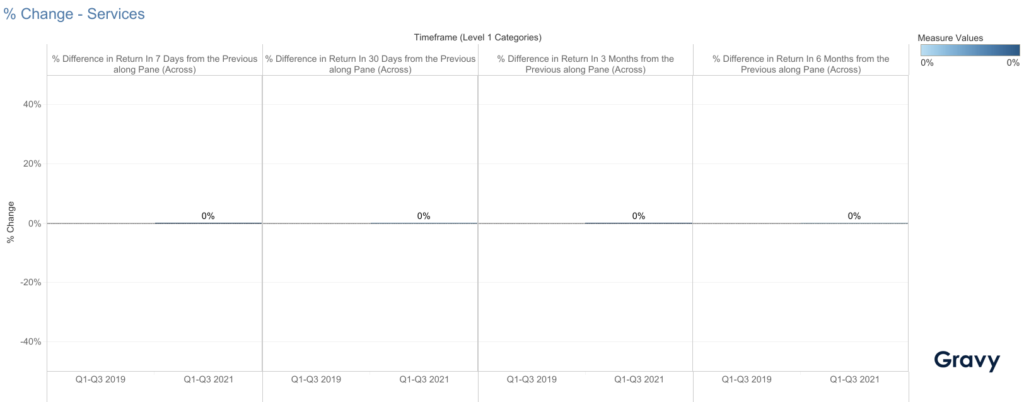
Services
Similar to the Restaurants & Food category, Services—like fitness, auto repair, and home improvement services—also saw virtually no change to the percentage of return visitors during any timeframe. This lack of a big shift in return visitors suggests that people aren’t occasional customers when it comes to services; many services are considered “essential” and consumers continue to return frequently to service providers they patronize.
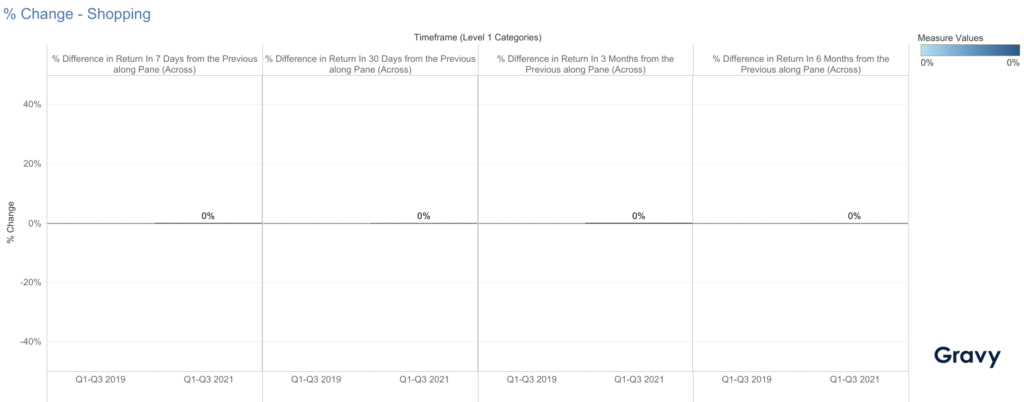
Shopping
The Shopping category, which includes big-box stores and malls, also saw no change in the percentage of return visitors within 7 days, 30 days, 3 months or 6 months. Although consumers are still shopping with regularity, it is important to note that people may be shopping less for luxury items and more for essentials like clothing, furniture, or household items.
Transportation
Across all timeframes, consumers were less likely to return to places in the Transportation category in 2021, compared to 2019. In 2019, 75% of consumers returned to transportation-related locations within 7 days, but in 2021 only 67% came back within that same time period — a -11% change. This may be due to people commuting less frequently during the workweek as a result of more people working from home.
Predicting Customer Loyalty Insights in 2022
Based on our data, it’s apparent that most locations in these categories are seeing habitual customers. Will these trends change in the new year? We predict that the transportation category will recover in 2022 as more people begin to commute once again. Shopping and restaurant locations will continue to welcome repeat customers, but outdoor venues and recreation centers might see a shift once indoor venues welcome back events. For more information on how your business can use consumer loyalty data to improve the customer experience, contact a location intelligence expert at Gravy Analytics today.