Retail Performance Roundup Q1 2022: Part 2
August 10, 2022

We’re continuing our look at how retailers performed in Q1 2022. If you missed Part 1 of this retail performance series, check it out here.
Just like our previous analysis, we compared foot traffic at major retailers in Q1 2021 to Q1 2022 to understand how they performed against their competitors. Let’s take a look at more retailers to see how they fared in Q1 2022, as prices for goods and services continued to climb due to inflation.
Coffee Chains: Starbucks & Its Competitors
Top 3 Takeaways:
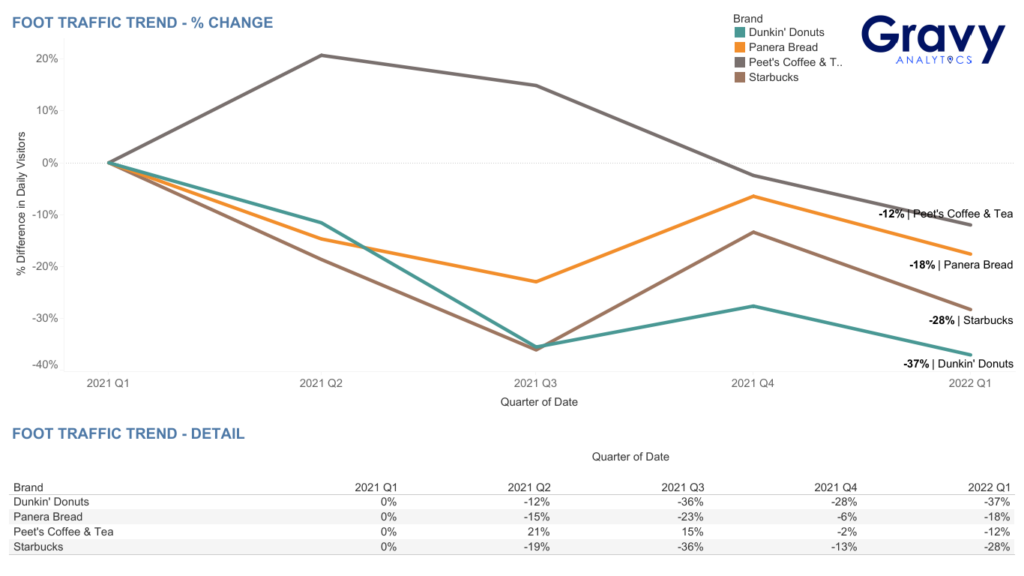
- Throughout 2021, Starbucks, Dunkin’ Donuts, and Panera Bread all followed similar foot traffic trends: a decrease in foot traffic in Q2 and Q3 2021, compared to Q1 2021 levels, followed by an increase in Q4 2021, then another decline in Q1 2022.
- Meanwhile, Peet’s Coffee foot traffic increased in Q2 2021 to levels above those seen in Q1 2021. However, foot traffic decreased each quarter through the end of the year. From Q4 2021 to Q1 2022, Peet’s Coffee foot traffic followed a similar trend as the other brands analyzed and further decreased.
- By the end of Q1 2022, each chain’s foot traffic was below the levels each brand experienced in Q1 2021. Starbucks saw a 28% decline, while Dunkin’ Donuts, Peet’s Coffee, and Panera Bread saw declines of 37%, 12%, and 18%, respectively, compared to Q1 2021.
What Does This Mean for Coffee Chains?
The year-over-year decline in foot traffic to Starbucks and its coffee chain competitors suggests that, despite easing COVID-19 restrictions, many coffee drinkers still prefer to order beverages to-go. In fact, there is a similar pattern across many types of quick-service restaurants, so it’s not surprising that lingering pandemic-related consumer habits could also be the cause of Starbucks’ decline in foot traffic.
Pharmacy Retailers: CVS & Its Competitors
Top 5 Takeaways:
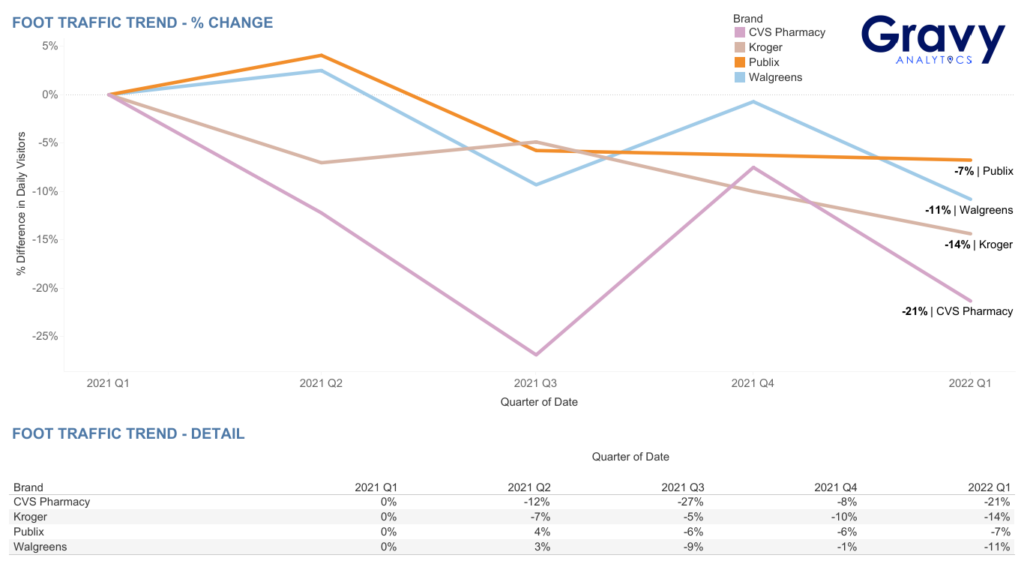
- CVS foot traffic decreased in Q2 and Q3 2021, to levels well below those seen in Q1 2021. In Q4 2021, CVS foot traffic increased from Q3 2021 levels but then decreased in Q1 2022.
- Although Walgreens and Publix saw increased foot traffic in Q2, compared to Q1 2021 levels, in Q3, both brands experienced a decline to levels below Q1 2021.
- In Q4 2021, Walgreens foot traffic increased, but decreased again in Q1 2022, similar to the trend CVS experienced during the same timeframe. Meanwhile, Publix foot traffic remained flat from Q3 2021 through the end of the year and into Q1 2022.
- Kroger experienced different foot traffic trends than the other brands analyzed, with Kroger seeing a decline in foot traffic in Q2 2021, compared to Q1 2021 levels. In Q3 2021, the brand saw a slight increase in foot traffic, followed by a steady decrease through the rest of the year and into Q1 2022.
- By the end of Q1 2022, each chain’s foot traffic was below the levels each brand experienced in Q1 2021. CVS saw a 21% decline, while Walgreens, Kroger, and Publix saw declines of 11%, 14%, and 7%, respectively, compared to Q1 2021.
What Does This Mean for CVS?
The decline in foot traffic CVS has experienced year over year and from Q4 2021 to Q1 2022 could mean that the demand for health and wellness products, as well as COVID-19 vaccines and tests, is waning as the majority of the U.S. population is now vaccinated and may not require health-related products and services to the extent they did during the height of the pandemic.
Supermarkets: Kroger & Its Competitors
Top 3 Takeaways:
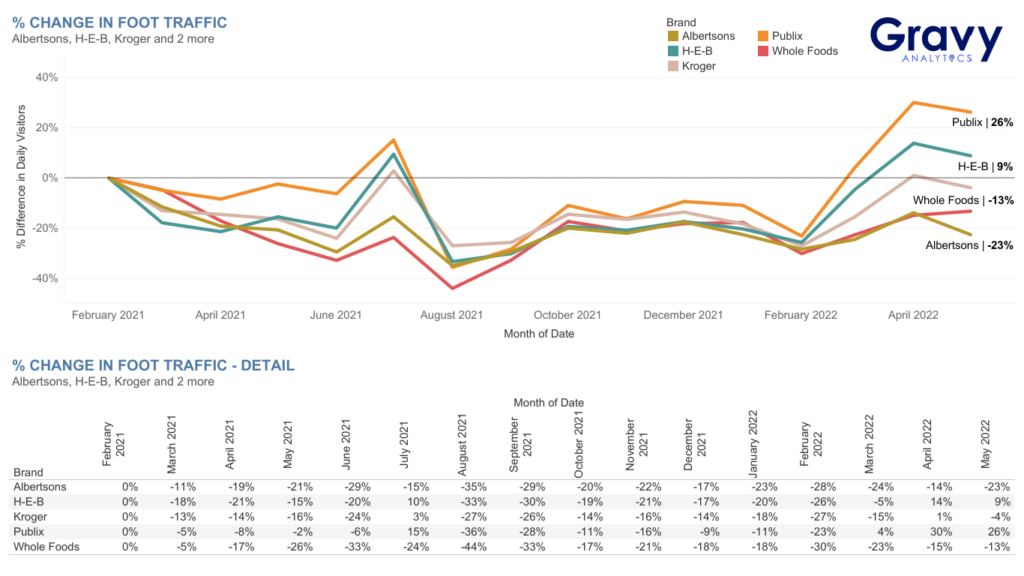
- Kroger and its competitors all generally followed similar foot traffic trends throughout 2021 and into 2022.
- In February 2022, foot traffic to Kroger was 27% lower, compared to February 2021. Albertsons, H-E-B, Publix, and Whole Foods saw declines of 28%, 26%, 23%, and 30%, respectively, over the same time period.
- In May 2022, Kroger, Publix, H-E-B, and Whole Foods foot traffic was above the levels each experienced a year prior in May 2021, while Albertsons saw a decline over the same period.
What Does This Mean for Kroger?
Initially, the rise in inflation did not appear to impact consumer visits to grocery stores as foot traffic to Kroger and its competitors increased in March and April 2022 when inflation rose to record highs. However, as inflation reached its highest level in four decades in May 2022, foot traffic to most grocery stores we analyzed declined, suggesting that the increased cost of groceries is causing consumers to shop less.
Apparel Retailers
Top 6 Takeaways:
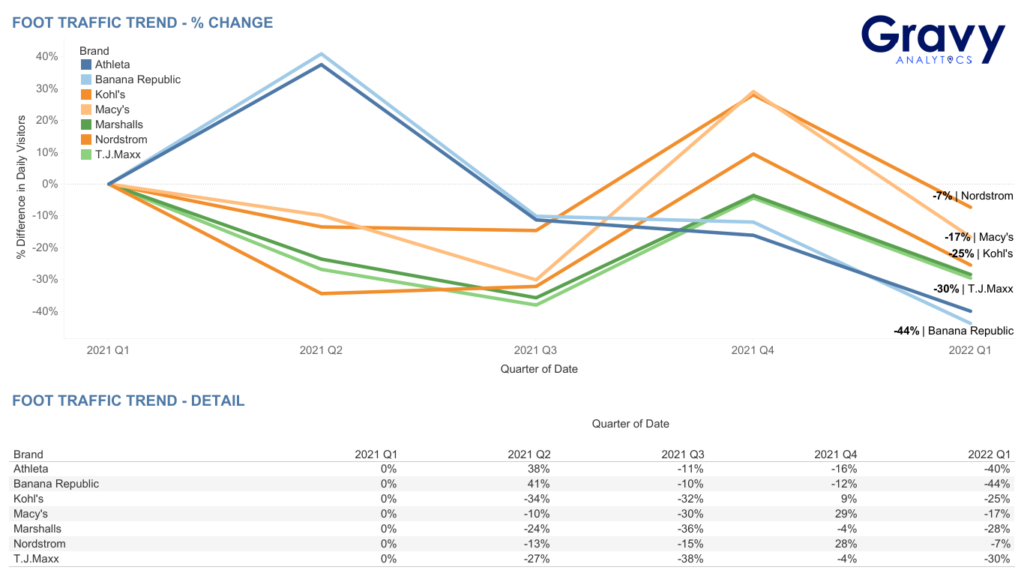
- T.J. Maxx, Marshalls, Kohl’s, Macy’s, and Nordstrom all followed a similar pattern in foot traffic throughout 2021 and into 2022.
- In Q2 2021, T.J. Maxx, Marshalls, Kohl’s, Macy’s, and Nordstrom experienced a decrease in foot traffic, compared to the levels these brands saw in Q1 2021.
- Foot traffic continued to decline in Q3 2021 for T.J. Maxx, Marshalls, Macy’s, and Nordstrom while Kohl’s foot traffic slightly increased. Foot traffic to these brands spiked in Q4 2021, and then decreased again into Q1 2022.
- Meanwhile, Gap Inc.’s Athleta and Banana Republic stores experienced different foot traffic trends from the other retail brands analyzed.
- Both brands saw foot traffic increase in Q2 2021 to levels above those experienced in Q1 2021. However, beginning in Q3 2021, through the rest of the year, and into Q1 2022, foot traffic to these stores steadily declined.
- By the end of Q1 2022, each brand’s foot traffic was below the levels each experienced in Q1 2021: Kohl’s (-25%), T.J. Maxx (-30%), Marshalls (-28%), Athleta (-40%), Banana Republic (-44%), Nordstrom (-7%), and Macy’s (-17%).
What Does This Mean for Clothing Stores?
While some apparel retailers sustained consumer foot traffic better than others, our data shows that there has been a year-over-year decline in traffic to many major retail brands overall. Although this could be due to consumers shopping online or picking up their purchases curbside, a key factor that’s more than likely contributing to this is high inflation, which is causing many consumers to put more of their budgets toward essentials like groceries and gas.
Retail Foot Traffic Trends as An Economic Indicator
As brands continue into the rest of the year, inflation, supply chain, and consumer spending are going to play a major role in the performance of the retail sector. Foot traffic data provides businesses with an understanding of emerging and current consumer behavior trends. This can ultimately help retailers get ahead of their competition and keep up with consumer demand.
Interested in more Q1 2022 consumer trends? Download the report here. For more information on how businesses can use retail foot traffic data to understand what is happening in the economy, contact one of our location intelligence experts today.