Retail and Restaurant Foot Traffic Slows in Q1 2022
June 6, 2022

Arguably, inflation has affected the retail and restaurant industries more than other economic sectors. With rising prices, consumers are limiting their trips to the store and going out less in order to save money. Has retail and restaurant foot traffic slowed down in the last few quarters in response to inflation? To answer this question, we analyzed foot traffic to subcategories related to restaurant and retail to understand how inflation has influenced consumer behavior in Q1 2022, compared to 2021.

Restaurant Foot Traffic
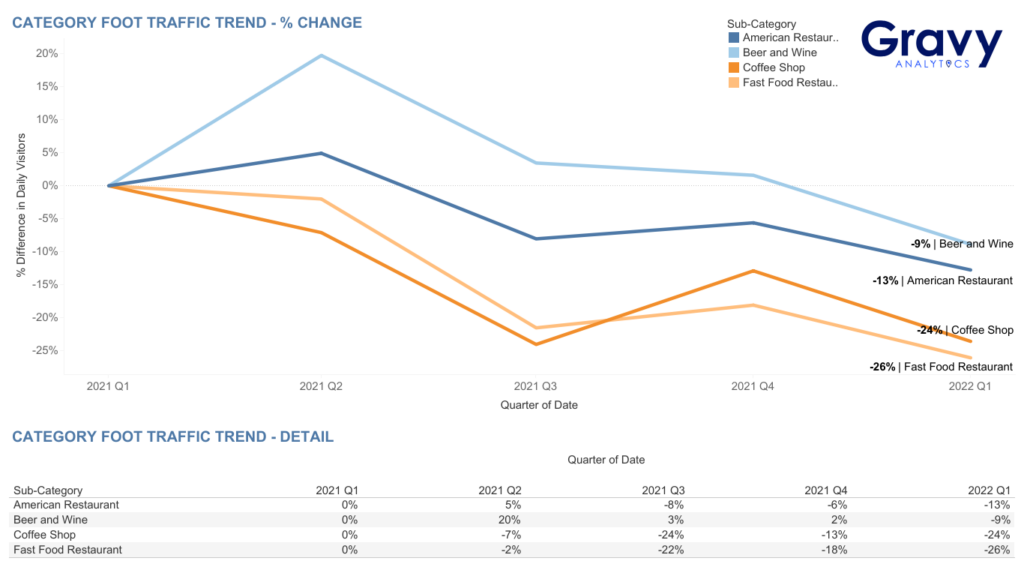
Beer and wine stores saw 20% higher foot traffic in Q2 2021, compared to the previous quarter. American restaurants also saw an increase in foot traffic during this time. The increase in vaccination rates could have caused more people to become comfortable with going out in the second quarter of 2021. After Q2 2021, all food and beverage categories saw a significant decline in foot traffic, perhaps an early sign of consumers starting to ease off on going out to eat.
Compared to beer/wine retailers, American restaurants, coffee shops, and fast-food restaurants saw a slight increase in foot traffic after Q3 2021. After Q4 2021, all categories saw foot traffic decline below Q1 2021 levels. By Q1 2022, foot traffic to coffee shops was 24% lower while traffic to fast-food restaurants was 26% lower than in the first quarter of the previous year. In contrast, foot traffic to beer/wine stores was only 9% lower and traffic to American restaurants was 13% lower, compared to Q1 2021.
Retail Foot Traffic
Big-Box Stores, Clothing, Furniture, and Home Improvement
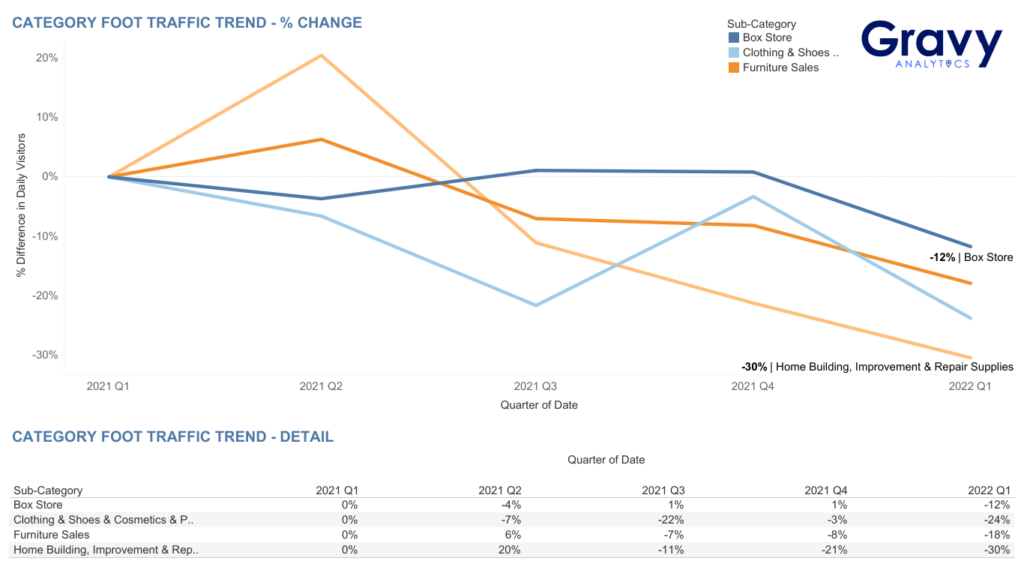
Foot traffic to furniture stores (+6%) and home improvement stores (+20%) peaked in Q2 2021. While home improvement foot traffic declined significantly after Q2 2021, furniture sales declined and then remained relatively flat until 2022. By Q1 2022, traffic to furniture store home improvement stores was 18% and 30% lower than Q1 2021. Does this mean consumer interest in DIY home improvement projects is waning? Yes, it is a possibility, especially as consumers are starting to focus more on purchasing essentials rather than home goods.
Clothing store foot traffic has remained below Q1 2021 levels. During the 2021 holiday season, clothing stores saw a spike in foot traffic from consumers looking to purchase gifts, but after Q4 2021, foot traffic once again declined. Big box stores saw a slight decline (-4%) in Q2 2021, compared to the previous quarter. Between Q3 and Q4 2021, foot traffic to big box stores was flat. However, in Q1 2022, big box stores saw another decline in foot traffic; traffic was 12% lower than the first quarter of 2021. This could be a result of inflation rates rising significantly during January, February, and March 2022.
Auto Parts Stores and Car Dealerships
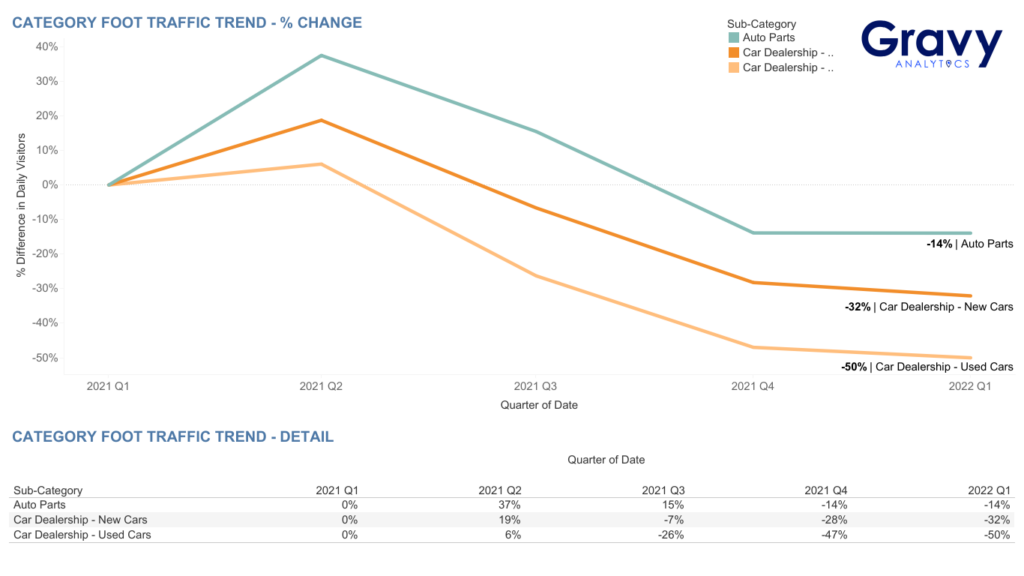
All car-related subcategories saw increases in foot traffic during Q2 2021, especially auto parts stores, which saw a 37% increase from the previous quarter. Consumers were more than likely visiting auto parts stores during that time to stock up on car parts in order to keep up with vehicle maintenance. However, after Q2 2021, foot traffic to auto parts stores and car dealerships saw a steady decline throughout the rest of 2021 and into 2022. This decline could be attributed to the rise in gas prices and decreased consumer interest in trading in and/or purchasing cars. By Q1 2022, auto parts store foot traffic was only 14% lower while traffic to new and used car dealerships was 32% and 50% lower, respectively, compared to the first quarter of 2021.
What to Expect in Q2 2022?
Inflation in April 2022 was at 8.3%, a bit higher than what it was in January (7.5%), but lower than March (8.5%). While inflation rates are expected to gradually recover, will foot traffic do the same? Based on our data, we predict that foot traffic to certain restaurant and retail subcategories, such as auto parts stores, big-box stores, and American restaurants, will return to Q1 2021 levels, while others will remain below those levels.
For more information on using foot traffic to measure economic growth, contact one of our location intelligence experts today.