DATA VISUALIZATION
Brand Attraction
The distance people travel reveals the relative attractiveness of the brand.
About this Dashboard
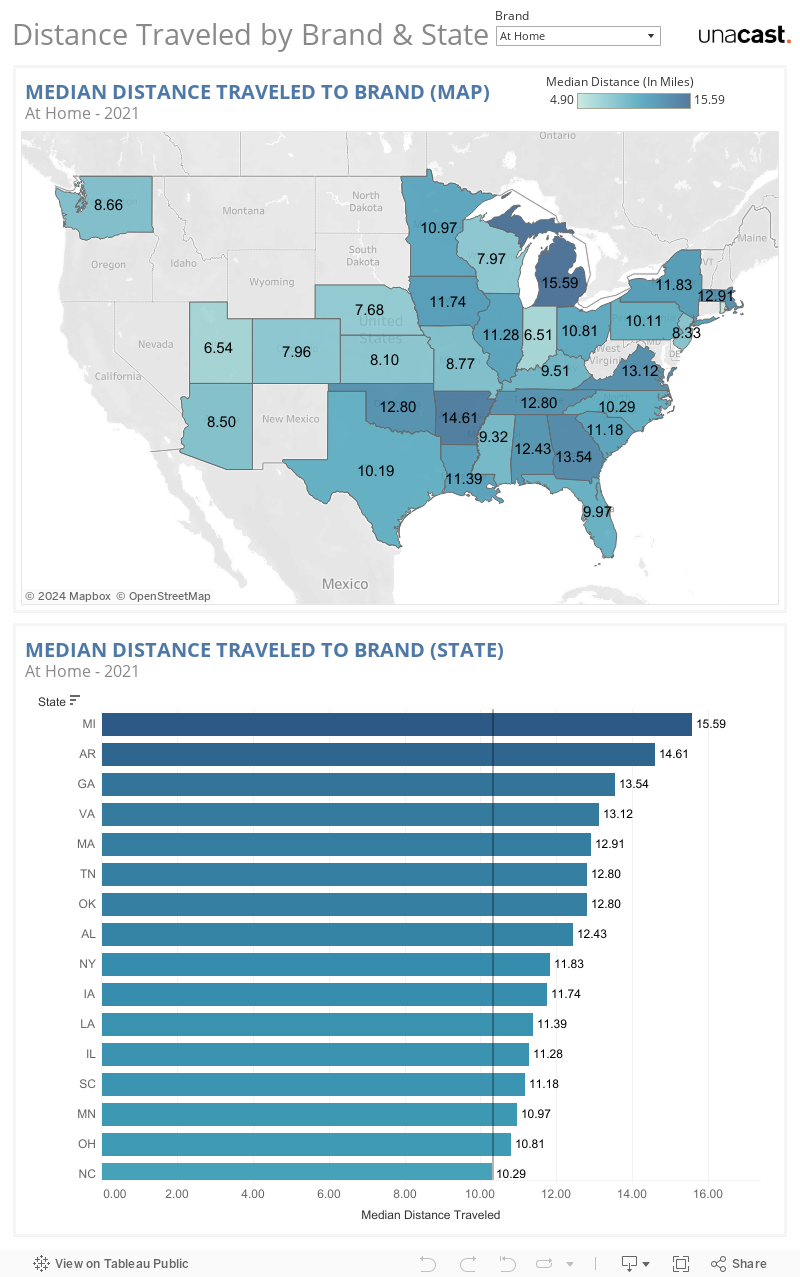
The attractiveness of a brand isn’t just measured by visits to a favorite store or restaurant. You can tell a lot about brand attraction by understanding the distance people travel to get there. After all, the distance we travel reveals how far people are willing to go to shop at Macy’s, work out at Gold’s Gym, or pick up groceries at Whole Foods, and the relative importance they place on doing so.
Gravy Visitations measures consumer visits to thousands of leading brands. Gravy’s Brand Attraction dashboard shows the average miles traveled to a sample of brands in an array of categories for all 50 states and Washington, D.C. This visualization demonstrates how the real-world behavior of U.S. consumers – as well as the relative attraction of each consumer brand – can differ by state or region.
Visitations and related metrics, like distance traveled, are most often used for audience targeting or for competitive intelligence. Distance traveled is a helpful metric for any brand that wants to target prospective customers within their stores’ likely trade area. From a competitive intelligence standpoint, distance traveled is an important indicator of brand strength and can help marketers better understand how their brand compares to other brands in the space.
Data Methodology
In total, Gravy captures more than 1B+ consumer visits to commercial places of interest every month. The visitations in this dashboard reflect the real-world behavior of U.S. consumers and are built on consumer mobile devices observed at thousands of different brands.
A visit is recorded when consumer mobile devices enter geofences associated with a specific brand or chain. Distance traveled is then calculated by finding the difference between the location of the devices’ point-of-origin with the location of the brand visited. The higher the distance traveled to visit a brand, the higher the attractiveness of the brand. This dashboard is built on aggregated visitation data observed during Q2 2021.
Use of Data for Media and Research Purposes
- If you are a journalist or researcher and would like to use this Brand Attraction data or other Gravy insights for media or research purposes, please let us know at info@gravyanalytics.com.
Get started with best-in-class data
All data presented in the dashboards is available on the Gravy Analytics platform.