DATA VISUALIZATION
Live Event Analytics
Event attendance is an extraordinarily powerful indicator of consumer interest.
About this Dashboard
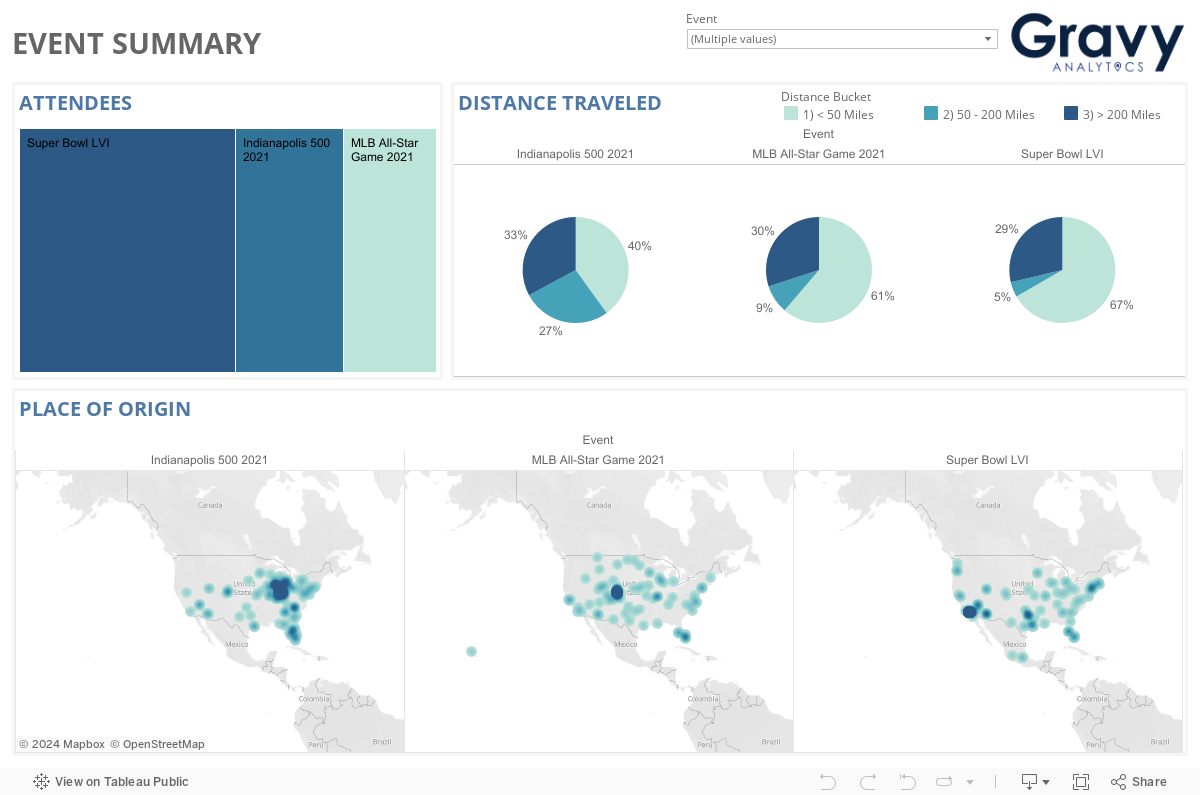
Gravy’s Event Analytics dashboard shows key metrics for U.S. consumer devices observed at some of the nation’s most popular live sports and entertainment events. This dashboard shows how the real-world behavior of U.S. consumers differs by game or event. In fact, live event analytics can be very different even when individual games or concerts are a part of the same series.
Gravy Visitations capture consumer visits to millions of commercial places of interest and thousands of daily, live events. By understanding not only where people go but why they are there, we can learn more about people’s interests and passions. To illustrate, a device observed at a rock concert more than likely belongs to a Rock Music Fan. Another device at a spin class probably belongs to a Fitness Enthusiast. For this reason, event attendance is an incredibly powerful indicator of consumer interest. A sports fan who watches Monday Night Football at home is not the same as a sports fan who holds season tickets. After all, event attendance is a commitment: it requires advance planning and the purchase of tickets. Often, there is also the time and expense of a trip away from home.
Event-based visitations are most often used for customer intelligence or for event analytics. By understanding the type of consumers at an event, event organizers can design marketing campaigns for future events that appeal to those consumers. Similarly, by understanding the brands and places that event attendees are likely to visit, event planners can discover potential sponsors and inform their sales strategy. Live event analytics can also help to prove sponsorship value for existing sponsors. Event sponsors gain visibility into the type of consumers they reach and can even measure event attendee engagement with the sponsor brand once the event ends.
A full suite of live event analytics (including those shown in this Event Analytics dashboard) is available via Gravy FanVue, which includes additional information about category and brand visits, as well as consumer personas.
Data Methodology
In total, Gravy captures visits to nearly a million unique events – large and small – every month. Gravy’s Event Analytics dashboard shows event data for a selection of top events in 2021 and 2022. This dashboard reflects the real-world behavior – including trade area and distance traveled – of the consumers who attended each event.
Event attendances are recorded when consumer mobile devices enter geofences associated with a specific event or events. It is important to note that event attendances will only be recorded when devices enter geofences at the time an event is scheduled to take place. For example, a visit to Madison Square Garden and attendance at a WWE event will be recorded at 8PM on a Friday evening (when the event is scheduled to occur), but only a visit to Madison Square Garden will be recorded at 8AM on a Monday morning. This dashboard is built on aggregated visitation data observed at selected events during 2021 and 2022.
Use of Data for Media and Research Purposes
- If you are a journalist or researcher and would like to use this Event Analytics dashboard or other Gravy insights for media or research purposes, please let us know at info@gravyanalytics.com.
Get started with best-in-class data
All data presented in the dashboards is available on the Gravy Analytics platform.