DATA VISUALIZATION
Food Deserts in Washington, D.C.
Using location analytics to understand foot traffic patterns in food desert neighborhoods.
About this Dashboard
What can foot traffic data tell us about food deserts? In 2018, the Office of Planning GIS published a polygon dataset of census block groups (CBG) in Washington, D.C. where residents travel farther to get food. These low food access areas, or food deserts, are estimated to be more than a 10-minute walk from the nearest full-service grocery store.
Food deserts are caused by a variety of factors, including public policies that disadvantage low-income and historically marginalized populations. These policies make it less convenient for people to buy food, which can affect their health and well-being. For this reason, it’s important that local governments and organizations have access to the technologies and data they need to learn how living in a food desert affects people in a community.
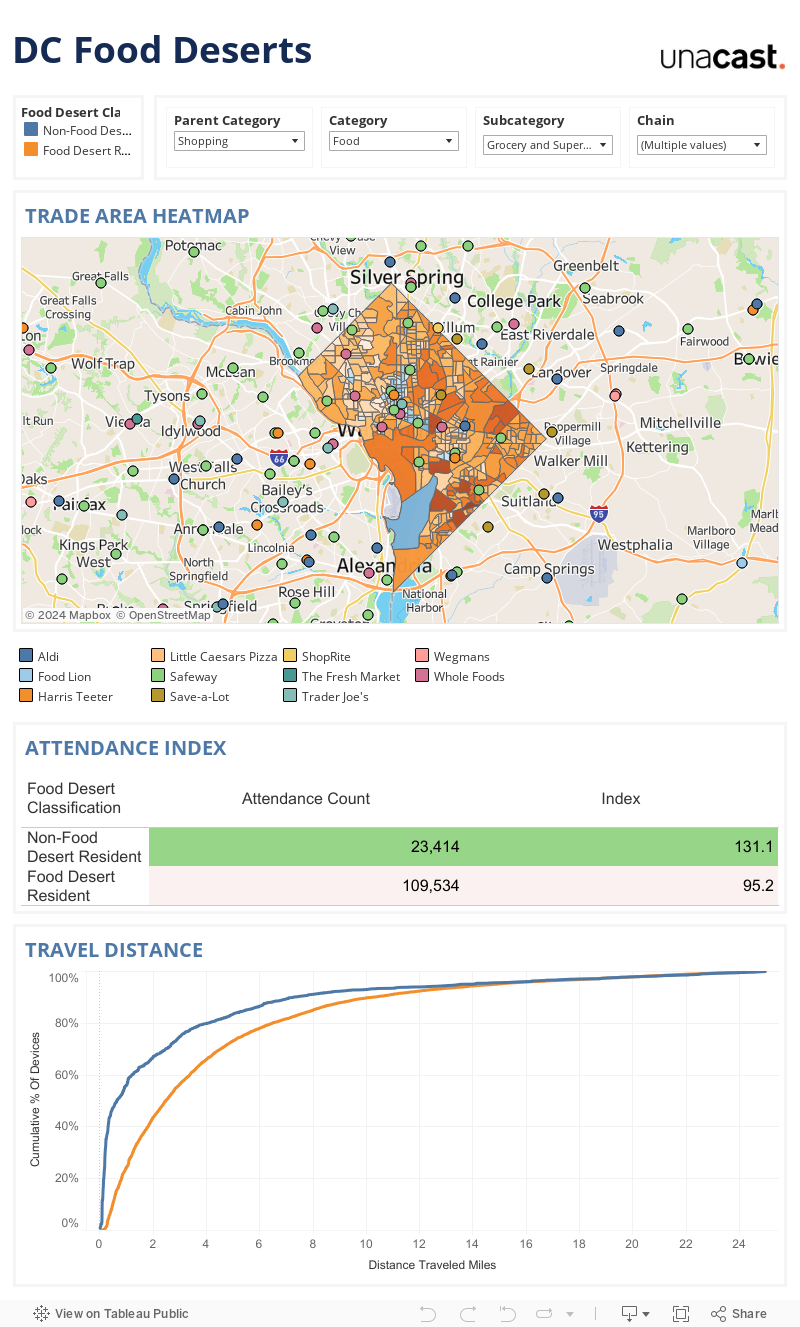
Our team of data analysts was interested in how location intelligence could be used to add to what the Office of Planning GIS found in their earlier study. To find out, data from Gravy’s Visitations dataset from July 2021 to March 2022 was analyzed with the open-source polygon dataset to learn more about how often D.C. residents go to grocery stores and other places in the metro area.
Data Methodology
Gravy looked at consumer visits to commercial places of interest as measured by consumer mobile devices in the Washington, D.C. metropolitan area. By looking at the signal patterns of these devices, our analysts were able to narrow down the data to likely Washington, D.C. residents and leave out information about visitors and people who live in other places. Finally, devices were assigned to a CBG and categorized within a food desert or non-food desert group in accordance with the Office of Planning GIS study.
Based on how these two groups of consumer mobile devices moved, three key metrics were calculated.
- Number of visits to each chain or venue category
- Travel distance
- Attendance index
Travel distance reflects the average distance traveled at each percentile. The attendance index shows how likely it is that a group of consumers will go to a place or place category. An index of 100 is average. People are less likely to visit a place when the index is below 100, while an index above 100 means that they are more likely to do so.
Use of Data for Media and Research Purposes
- If you are a journalist or researcher and would like to use this Food Desert data or other Gravy insights for media or research purposes, please let us know at info@gravyanalytics.com.
Get started with best-in-class data
All data presented in the dashboards is available on the Gravy Analytics platform.