Measuring COVID-19’s Impact on Foot Traffic in the U.S. and Seattle
March 19, 2020

The impact of COVID-19 is being felt around the world, radically changing the way we live and work. Although this situation is evolving rapidly and changing day to day, location data provides useful insight into human movement and foot traffic patterns to further illustrate the impact of COVID-19 on our daily activities.
Using aggregated location data for the period between January 1 and March 7, 2020, Gravy Analytics examined foot traffic patterns across the country as well as the Seattle metro area (the epicenter of the COVID-19 outbreak in the U.S.), to determine what impact the virus has had on both consumers and businesses to-date.
Restaurants & Travel
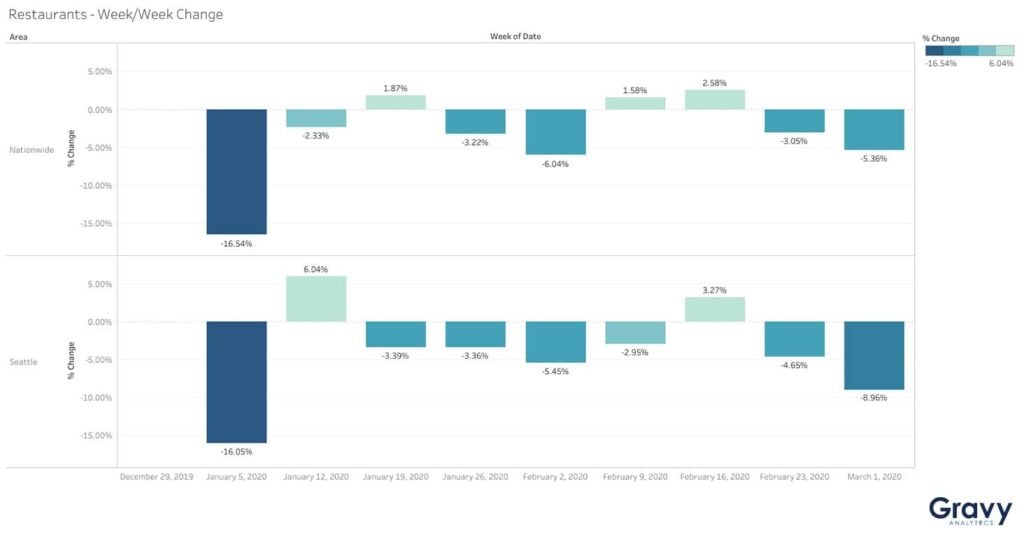
During the first week of March, visits began to decrease at restaurants nationwide. American restaurants, on average, saw a 5% decrease in foot traffic compared with the previous week. This effect was even more pronounced in Seattle, which saw foot traffic decline by almost 9%.

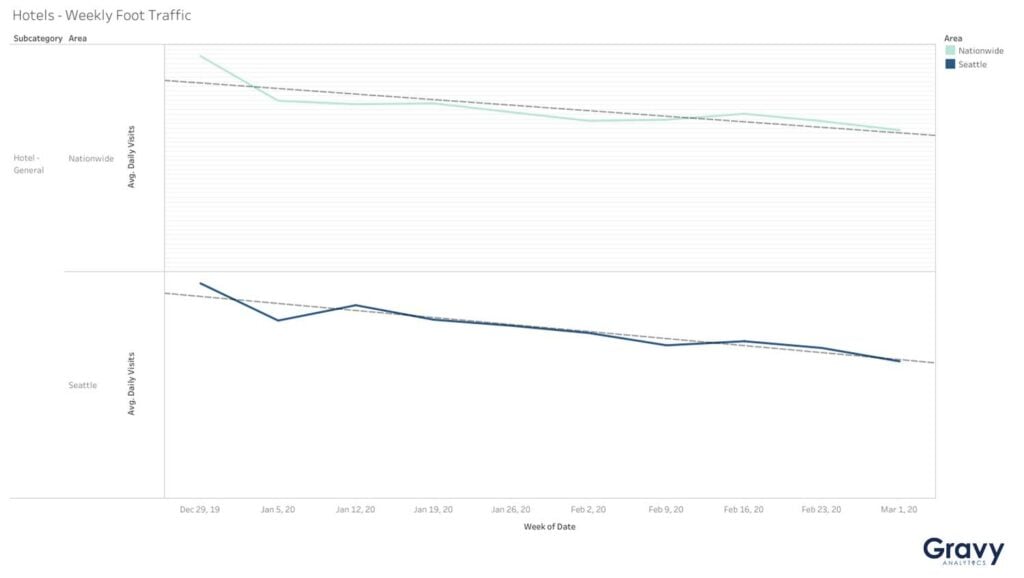
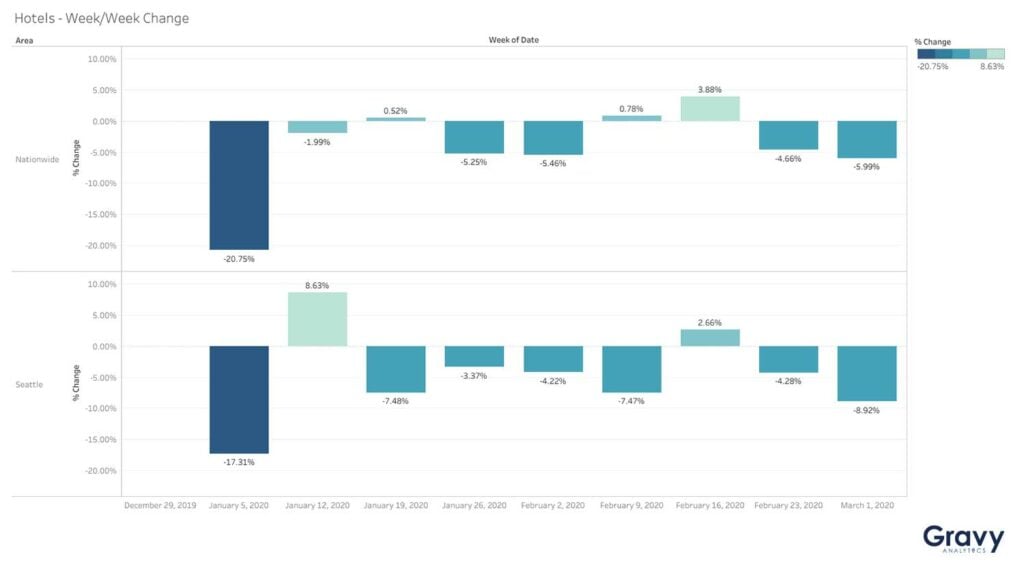
Foot traffic at hotels and other accommodations also slowed: nationwide, hotels saw a 6% decrease in average weekly visits and a 9% decrease in the Seattle metro area. Visits to cruise ships, one of the earliest venues hit by the COVID-19 outbreak, saw a dramatic decline in Seattle.
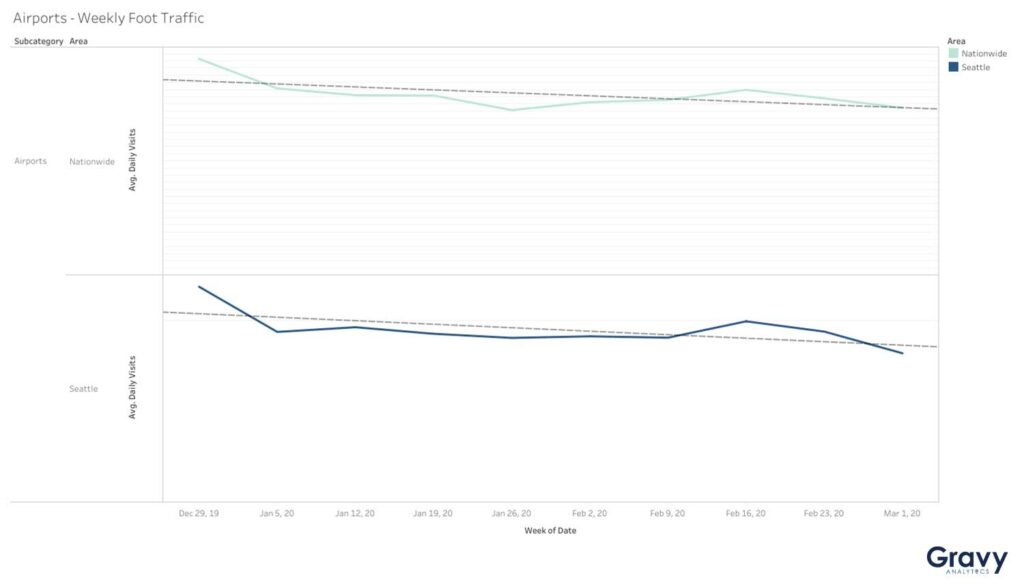
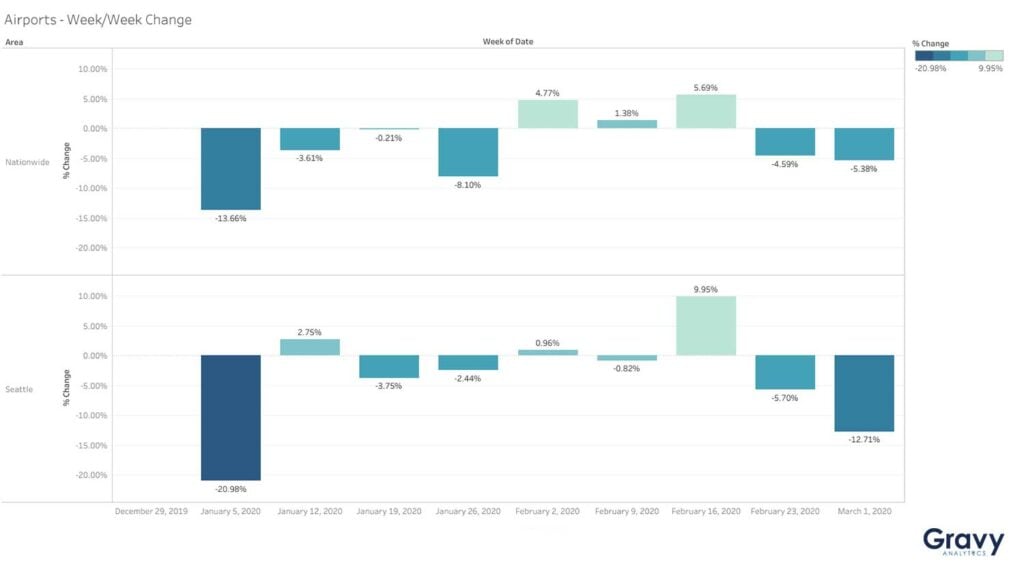
During the same period, the use of public transportation also started to decline: the nation’s airports received 5% fewer overall visits week over week, and Seattle’s 13% fewer.
Food, Pharmacy & Other Supplies
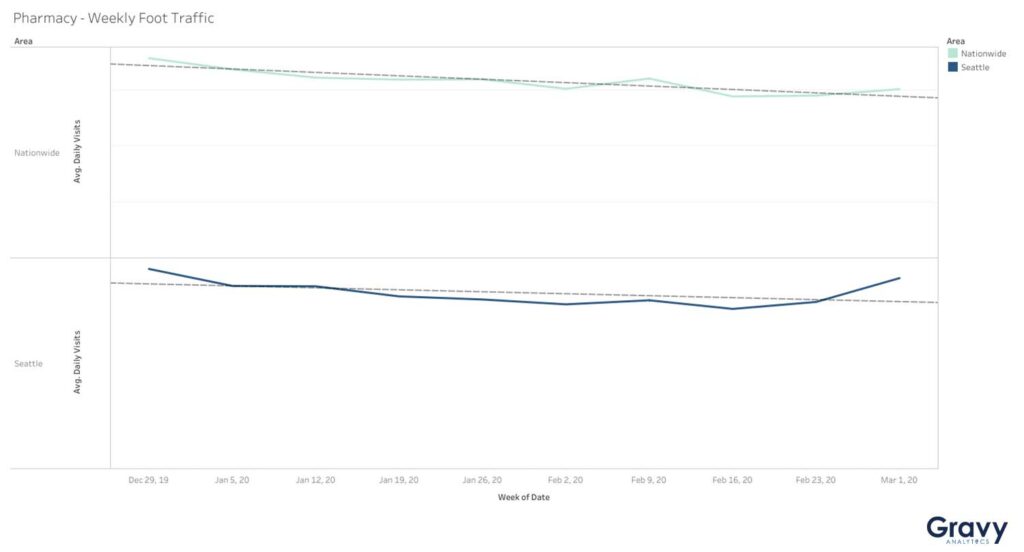
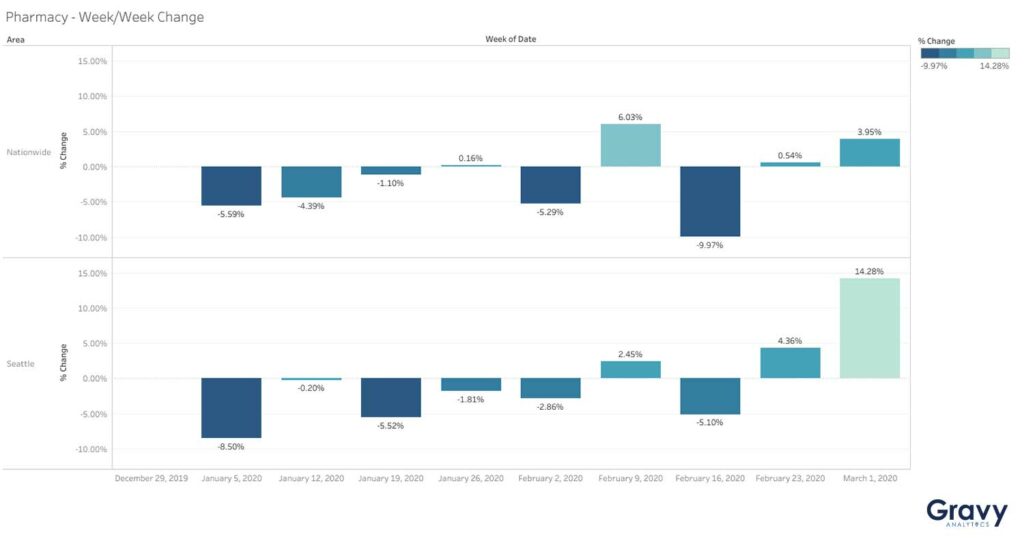
As confirmed COVID-19 cases began to accelerate in late February and early March, consumer priorities began to shift, reflected in foot traffic changes. Gravy observed material increases in weekly foot traffic at both pharmacies and grocery stores, evidence of consumers stocking up on medicine and filling their pantries. In the Seattle area and nationwide, visits to pharmacies increased by 14% and 4%, respectively.
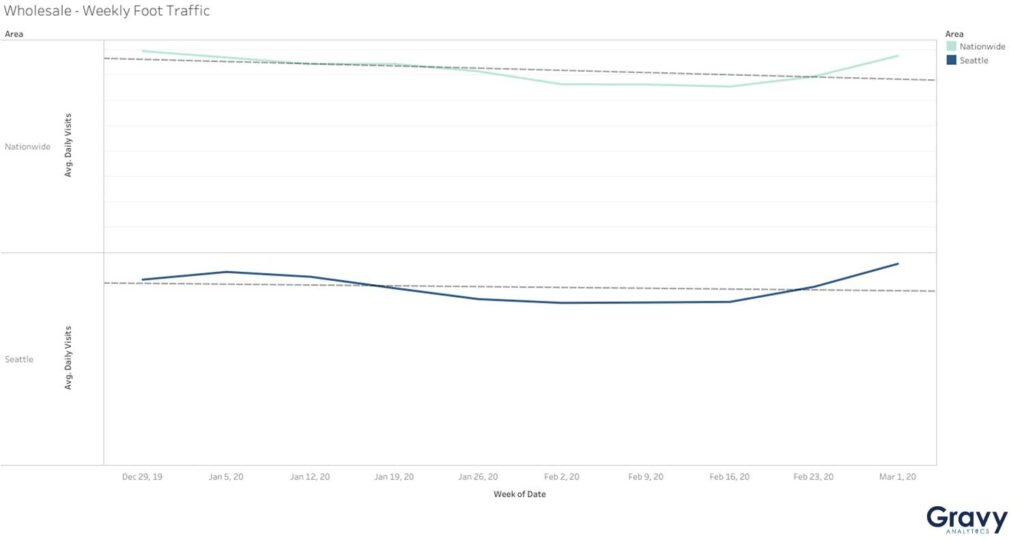
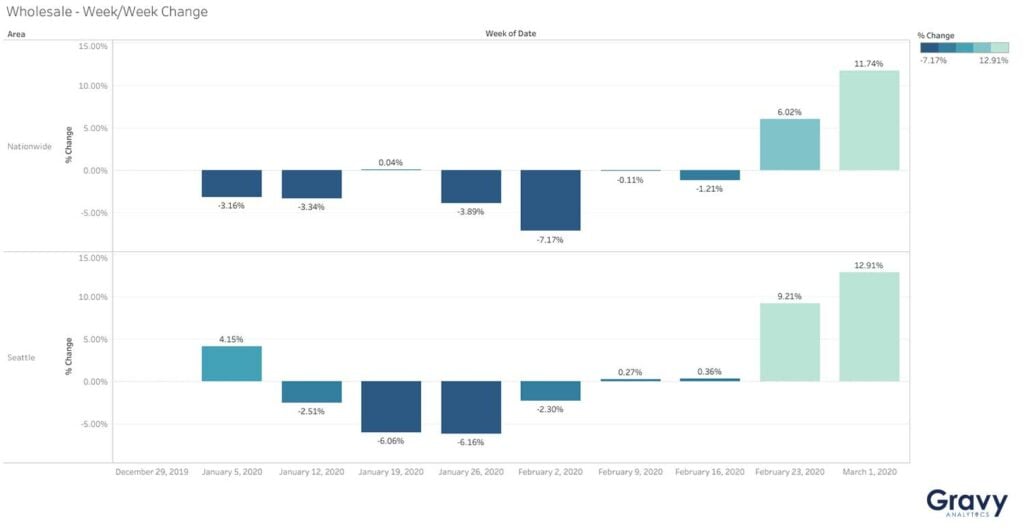
Wholesale stores saw a 12% increase in average foot traffic nationwide and the Seattle area saw a 13% increase in foot traffic. Stores offering other basic necessities, like baby equipment and pet supplies, also experienced a boost in foot traffic.
Entertainment, Errands, & Outdoor Activities
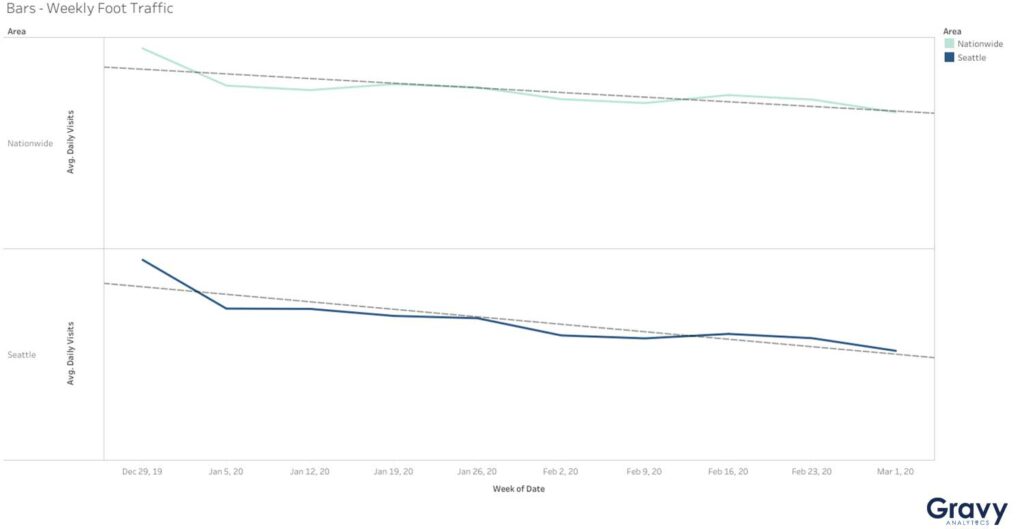
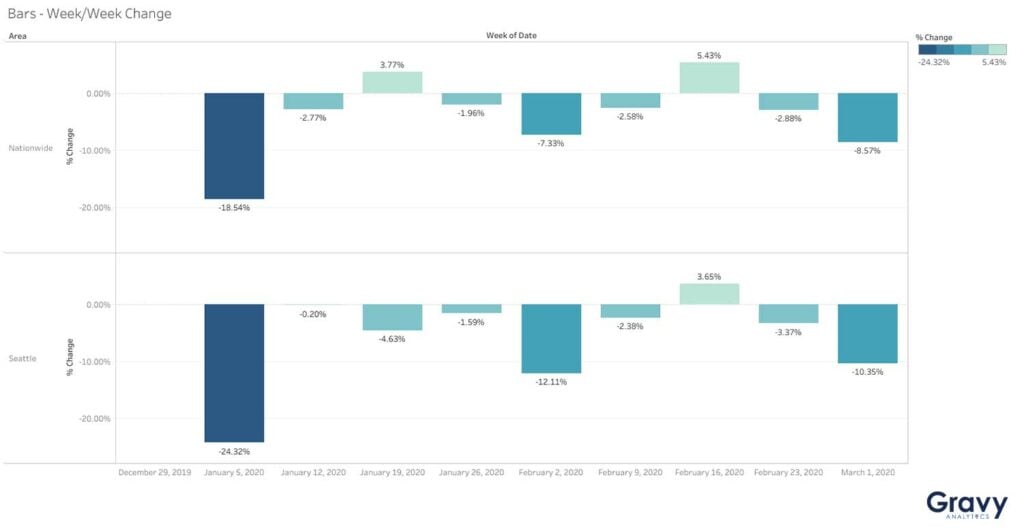
As more people began to practice social distancing, foot traffic to nightspots including bars and music venues began to slow: average weekly foot traffic at bars nationwide and in Seattle decreased by 9% and 10%, respectively.
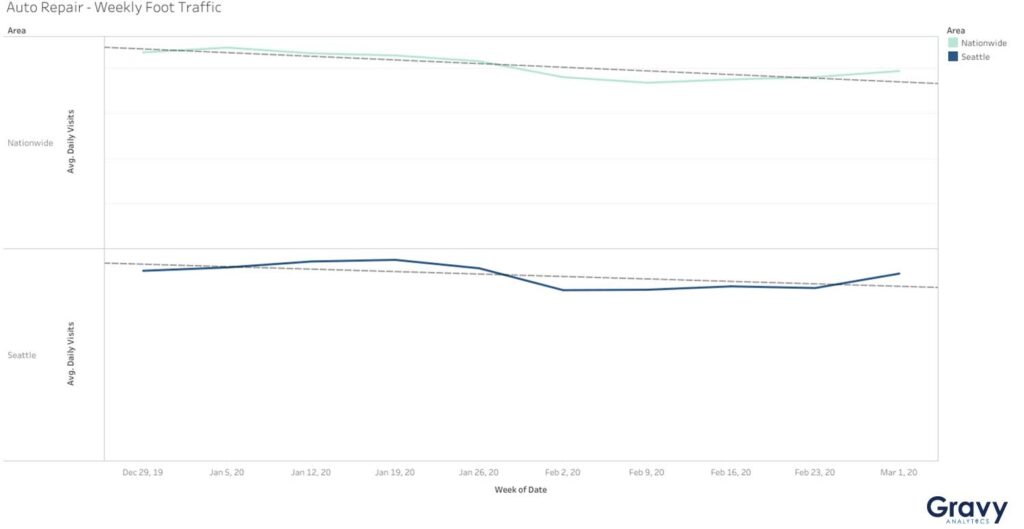
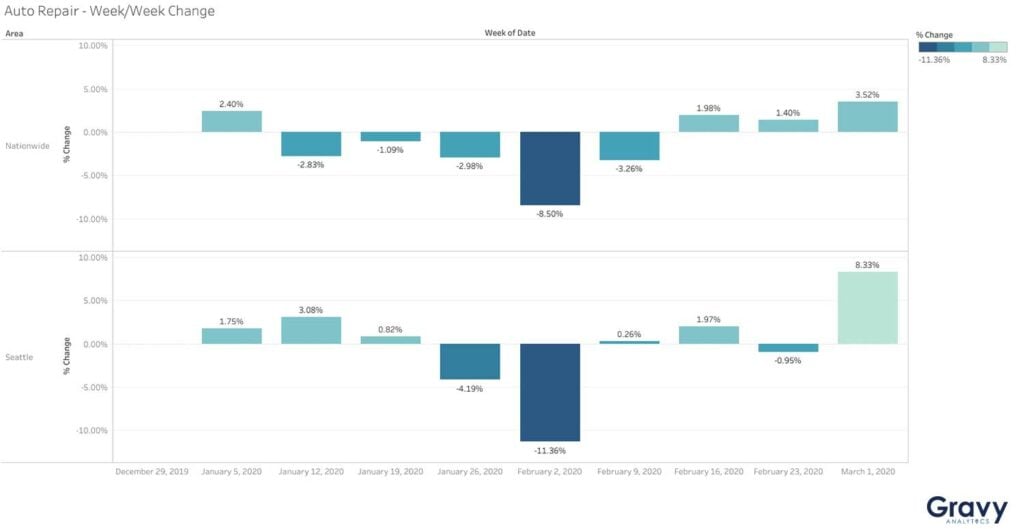
At the same time, and perhaps putting the needs of the family first, car and home maintenance-related visits increased. Auto repair shops saw a 4% increase in visits nationwide, and visits to Seattle auto repair shops increased by 8%.
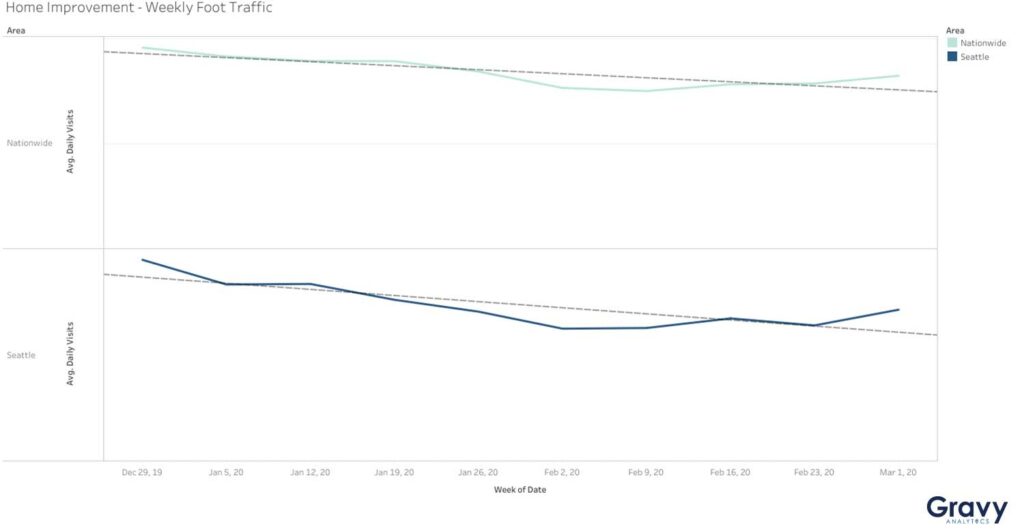
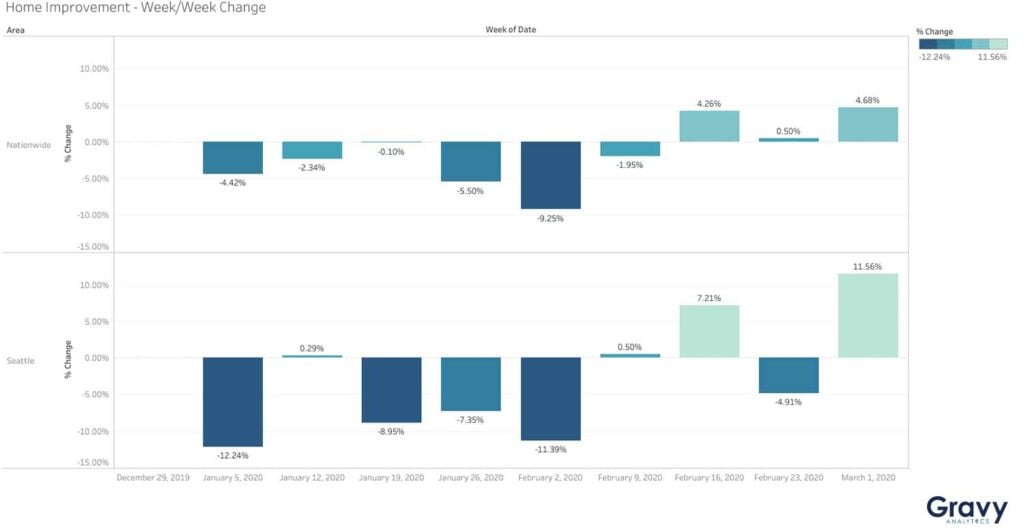
Home improvement store visits increased by 5% nationwide and 12% in the Seattle metro area.
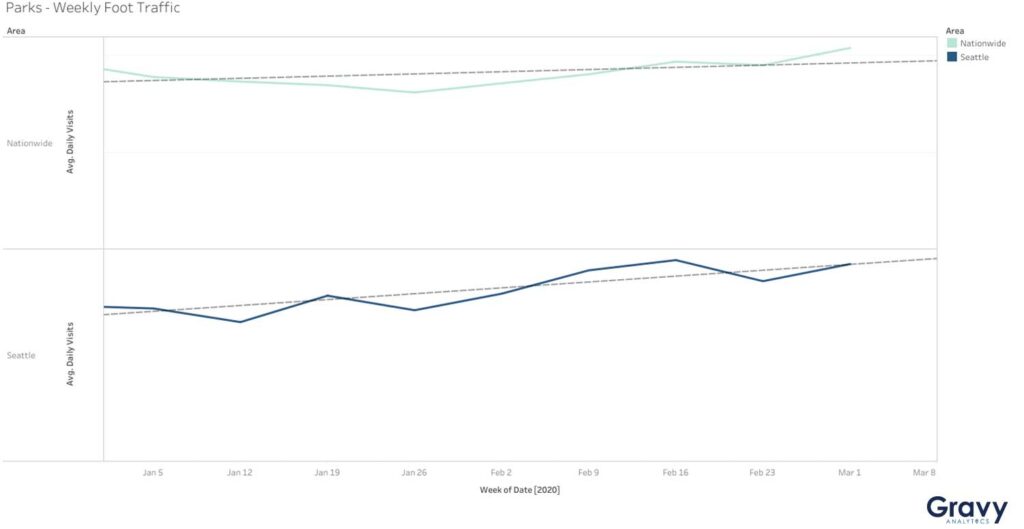
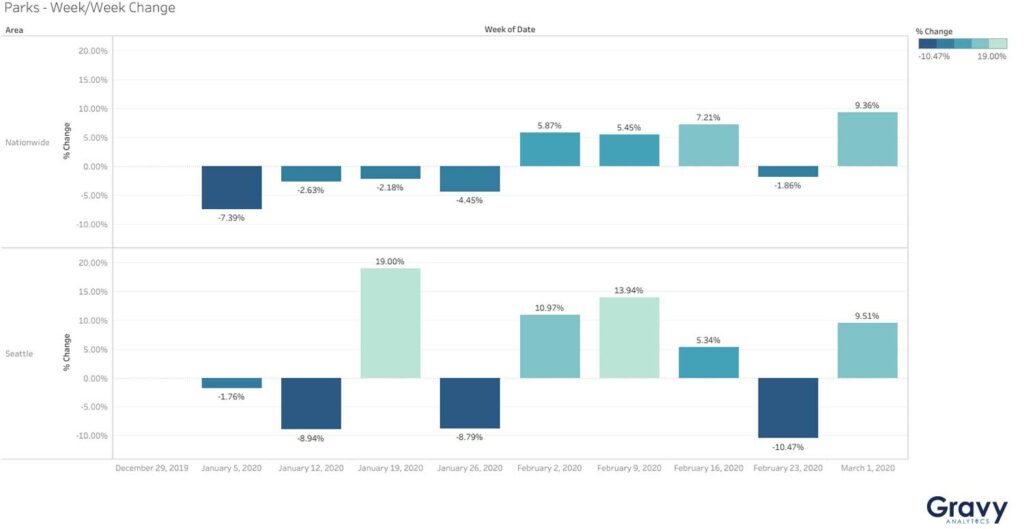
Whether Americans were anticipating a near-lockdown, or they just needed to get some fresh air, more people also went to parks: Gravy saw a more than 9% increase in average weekly visits to parks both nationwide and in the Seattle area.
COVID-19 is quickly changing how Americans live their daily lives, and Gravy’s foot traffic data shows what truly matters to us: health, friends, family, and community. Gravy’s human movement data indicates that people are adapting to the situation with resilience and solidarity, and putting what truly matters first. For more on Gravy’s response to COVID-19, read this message to the community from our CEO Jeff White.