REPORT
The State of U.S. Population Movement
Are you curious about the factors that motivate people to relocate to new areas? Is it the draw of a lower cost of living, the prospects of fresh employment opportunities, or the abundance of dining and entertainment options? Perhaps it’s a combination of all these factors. Our report, The State of U.S. Population Movement, examines the impact of various factors on population movement trends nationwide.

This report looks at how the population of the United States has changed between Q1 2020 and Q1 2023. It uses mobile device signals observed in every county across the country to assess population distribution. When the vast majority of a device’s associated signals are present in that state or county, it is recorded in that location. The proportion of total devices in a state or county is calculated by dividing the number of unique devices observed in that state or county by the overall number of unique devices. The difference in the number of unique devices observed in a region is then used to calculate changes in population distribution. The report covers unique devices discovered during a three-year period beginning in January 1, 2020, and ending March 31, 2023. Notably, Gravy Analytics collects more than 60 billion location signals from consumer mobile devices every day.
Top Gaining States (and Losing) Counties
Upon analyzing the top ten counties (Figure 1) that experienced the highest population growth and contrasting them with the ten counties that encountered the largest population decline, distinct trends emerge. It becomes evident that consumers preferred smaller markets with lower average housing costs. The median house value in counties experiencing population growth was $279K, which is approximately 38% lower than the median house value in counties experiencing population loss. Meanwhile, the median household income in these growing counties was only 9% lower, demonstrating that people chose to relocate to locations where they could work while maximizing the value of their wages.
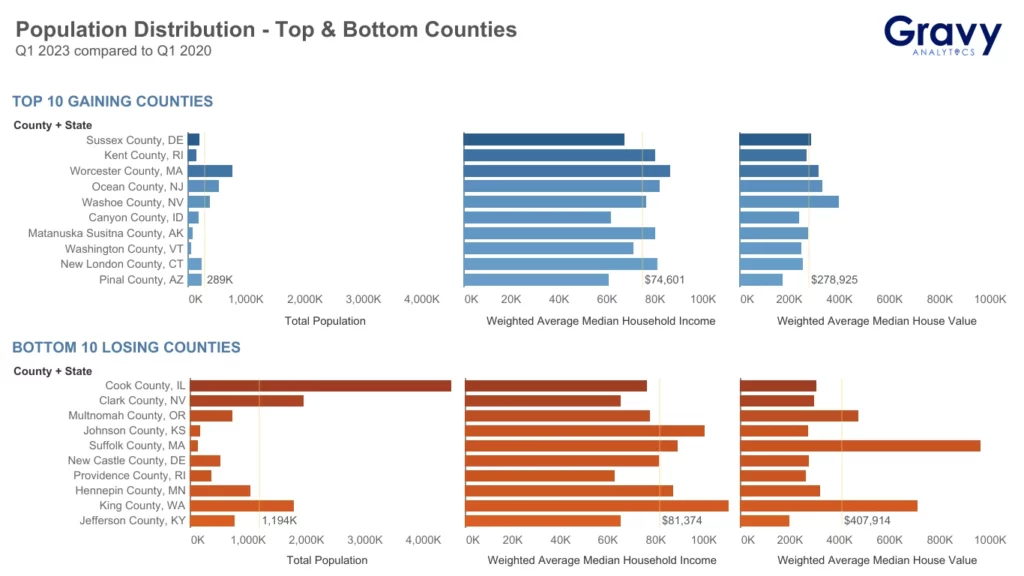
Figure 1: The chart shows a detailed breakdown of the top and bottom countries within each state, as determined by population growth or decline. The information comprises the total population, average median household income, and house value.
Related Resources: The Changing Habits of the Post-Move American
Ready to learn more?
Request our complimentary report to gain more insight into changing consumer behaviors, including, but not limited to:
- An in-depth examination of consumer preferences by examining the specific locations where the population have chosen to relocate.
- The counties in each state of the United States that are experiencing the greatest population growth and reduction
- The five most important trends influencing consumer behavior in 2023