Exclusive Preview: A Study of Shopping Mall Analytics: Mall of America
May 5, 2021

With the onset of the COVID-19 pandemic, many malls closed their doors during lockdowns, resulting in shoppers venturing online to purchase non-essential items. While many malls have reopened, some aren’t seeing as many visitors as they used to, and this has caused concern for the future of malls. To understand how the coronavirus pandemic has affected malls, we decided to take a look at Mall of America, the largest shopping mall in the United States.
So, how has COVID-19 impacted Mall of America? To understand the pandemic’s impact on Mall of America, we used Postman to call two different Gravy Area APIs: the Area Visitors API and Trade Area API. We launched Gravy APIs to allow analysts to quickly access the location data that they need in a timely manner.

Here are the APIs and their corresponding analyses:
- Foot Traffic: Area Visitors API
- Visitor Personas: Area Visitors API
- Trade Area (Catchment Area): Trade Area API
In order to get the data that we needed via the API, we entered the following parameters:
- Geofence coordinates: Include the latitude and longitude of places of interest. You have the ability to add multiple locations.
- Time range: Add start and end date. (Note: This is in epoch time.)
- Forensic flags: Add Gravy forensic flags that you would like to apply to the data. (Note: This parameter is optional.)
We then imported the data into our BI tool of choice, Tableau, to create the visualizations presented in this analysis.
As you read through this analysis, keep in mind that we are analyzing sample data. Let’s get started with taking a look at monthly foot traffic at Mall of America.
Monthly Foot Traffic Analysis
To understand how the coronavirus pandemic has impacted consumer visits to Mall of America, we compared monthly foot traffic data for 2019 and 2020 (refer to Figure 1).
In 2019, foot traffic to Mall of America was at its highest during the month of August. By April 2020 (when COVID-19 lockdowns were in effect across the U.S.), visits were a mere 4% of the average 2019 traffic, and continued to remain low in May. As the summer of 2020 approached, foot traffic began to recover.
By August 2020, visits were 66% lower than in 2019. We expected that visits in December 2020 would exceed August, but that was not the case. Even holiday shopping season didn’t seem to help the mall in terms of visits; December 2020 was 64.2% lower than the previous year. Even in 2021, foot traffic still hasn’t recovered, possibly due to COVID-related restrictions. As of February 2021, foot traffic was 83.6% of 2019’s average foot traffic.
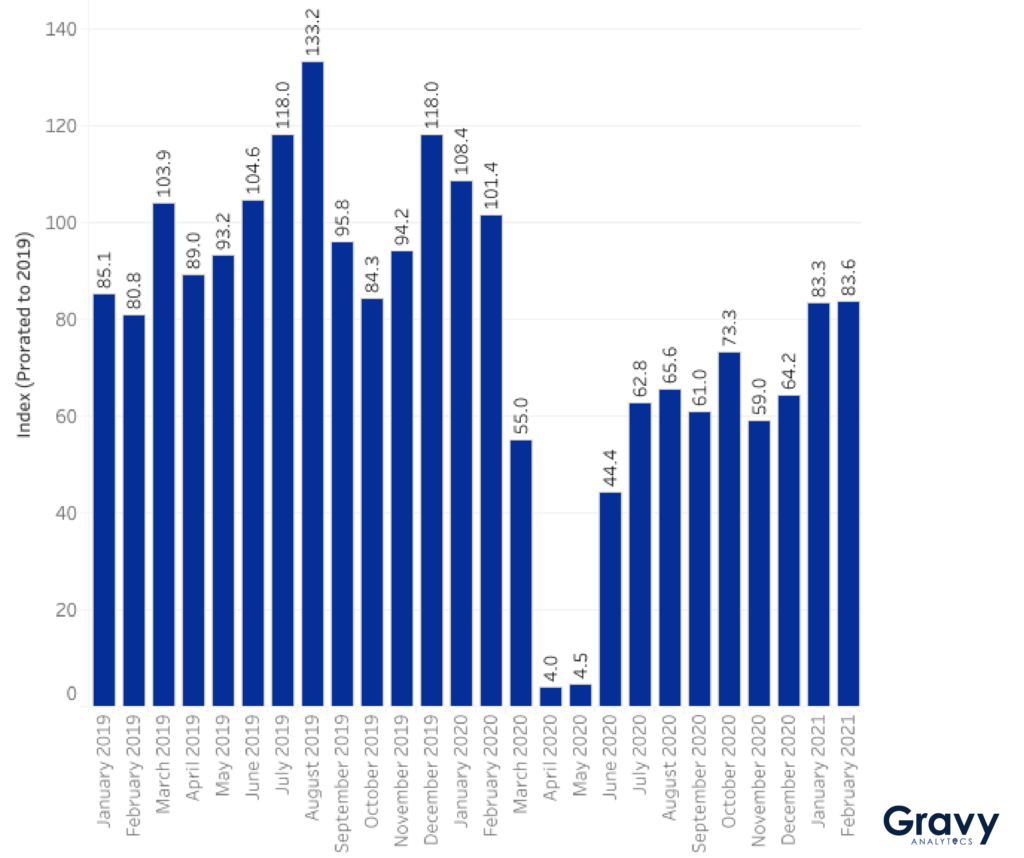
Data is prorated to the average foot traffic of 2019.