Where Are People Moving?:
Q2 2022 Edition
September 30, 2022

The COVID-19 pandemic caused many people to rethink their relationships with everything from work to finances. As a result, the housing market became suitable for buyers and sellers. This resulted in most people moving to more affordable areas in 2020. Two years later, rising inflation rates and a shifting housing market are making headlines, and consumers are facing rising costs, even in areas that were once considered to be affordable. Our recent consumer survey report found that 34% of consumers reported a higher-cost of living post-move. If this is the case, where are people moving? We compared human mobility data from Q1 2020 and Q2 2022 to understand how population distribution has changed in the U.S.

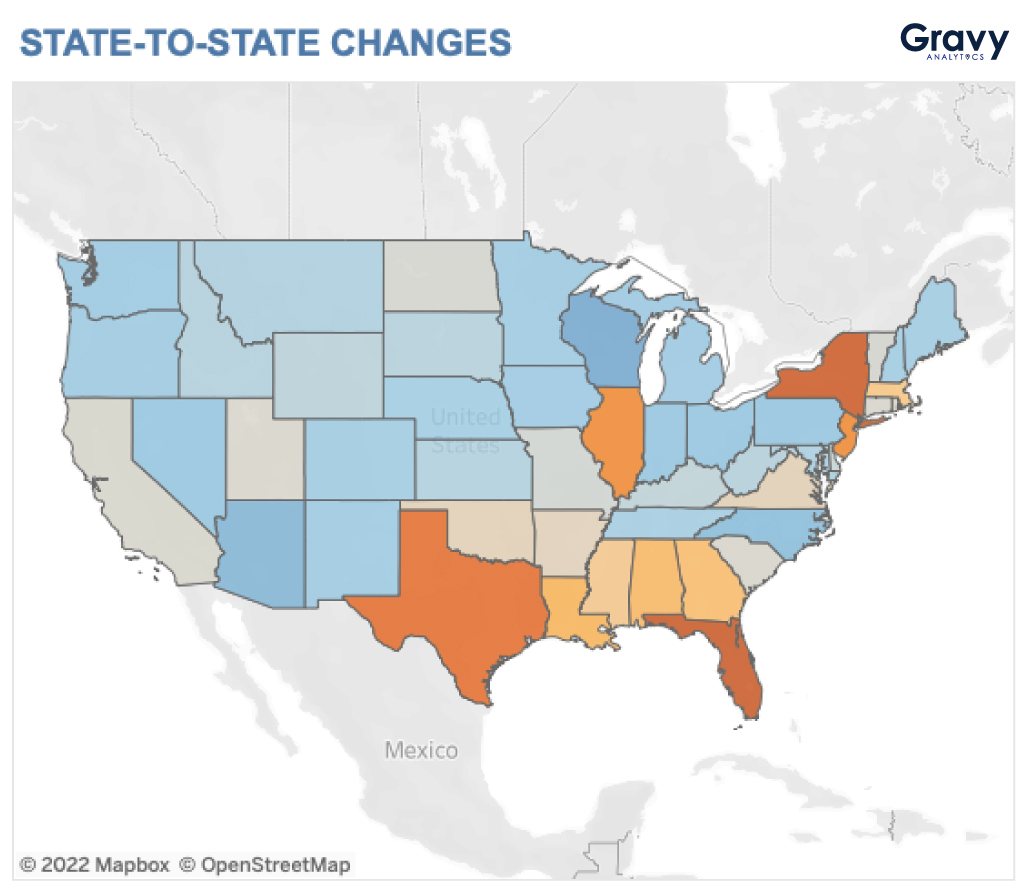
Which States Gained the Most Population in Q2 2022?
The state that gained the most population in Q2 2022 was Wisconsin. Why are people moving to Wisconsin? They might be moving to the Badger State for quality of living. According to a study by WalletHub, Wisconsin ranked in the top ten for states that have the highest quality of living. It’s not just the quality of life that is attracting people to Wisconsin; the state is also known for being an affordable place to live.
Here are the top five states that gained the most population:
- Wisconsin
- Arizona
- North Carolina
- Ohio
- Pennsylvania
Which States Lost the Most Population in Q2 2022?
The state that lost the most population in Q2 2022 was Florida. Before Q2 2021, the Sunshine state saw significant population growth, as many remote workers moved there for its warm weather, beaches, and lack of a state income tax. What could be the cause of Florida’s population loss? It’s possible that seasonality contributes to Florida’s fluctuations in population. Another major factor could be the cost of living. The cost of living in Florida is higher than it used to be, and this is especially true for retirees, which make up a large percentage of the state’s population.
Here are the five states that lost the most population:
- Florida
- New York
- Texas
- Illinois
- New Jersey
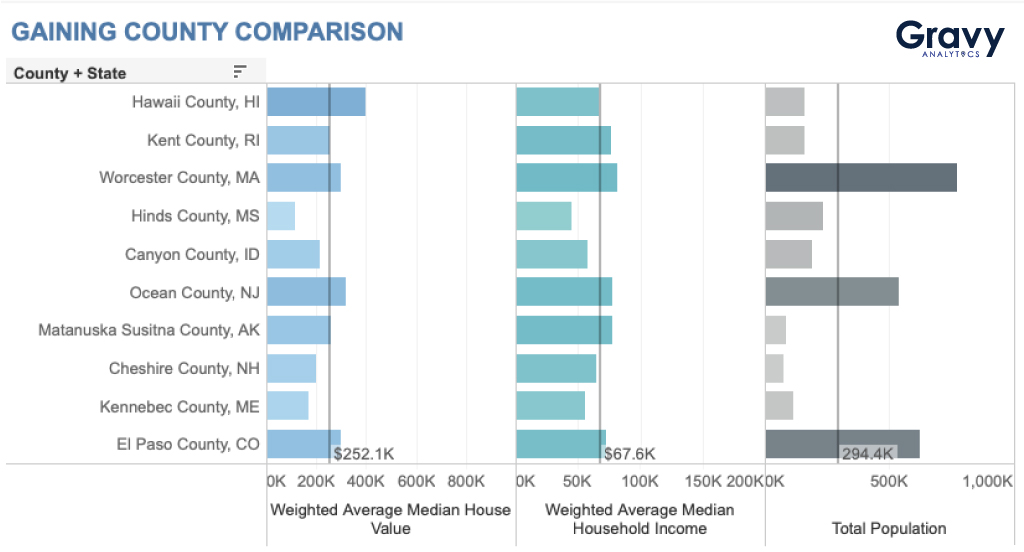
Which Counties Gained the Most Population in Q2 2022?
Which counties gained the most population? Hawaii County, Kent County, RI and Worcester County, MA are among the top U.S. counties that experienced population growth in the second quarter of 2022. Worcester County is known for affordable housing, close proximity to Boston, and its variety of entertainment options, including nightlife and outdoor recreational activities. The county over-indexed for median household income, total population, and average median household income. These factors might cause the county to face a housing crisis in the near future.
Here are the top counties that gained the most population:
- Hawaii County, HI
- Kent County, RI
- Worcester County, MA
- Hinds County, MS
- Canyon County, ID
- Ocean County, NJ
- Matanuska Susitna County, AK
- Cheshire County, NH
- Kennebec County, ME
- El Paso County, CO
Which Counties Lost the Most Population in Q2 2022?
Cook County, IL had the most population loss compared to other counties within the United States during the second quarter of 2022. Why are people moving away from Cook County? In 2021, Illinois saw the largest departure of residents, compared to other states in the U.S., and it’s apparent that this trend is continuing into 2022. Many people are leaving Cook County for warmer areas, better job opportunities, and more affordable housing.
Here are the top ten counties that have lost the most population:
- Cook County, IL
- King County, WA
- Johnson County, KS
- Providence County, RI
- Cumberland County, ME
- Suffolk County, MA
- Los Angeles County, CA
- Fairfield County, CT
- Maricopa County, AZ
- Weber County, UT
Why Organizations Need Population Distribution Data
Population distribution changes over time, and we can expect populations in the U.S. to continue to shift in reaction to socioeconomic factors, especially the rising cost of living associated with inflation. By mapping changes in populations, organizations can understand how consumer behavior and market trends flow from one area to another. These trends can be enriched with additional datasets and this can provide organizations with more in-depth insights. Interested in exploring population distribution data? Discover movement trends on our U.S. population distribution map, and then connect with one of our experts.