How is California’s Economy Performing?
August 3, 2022

California, like the rest of the U.S., has recently experienced a surge in COVID cases as well as rising prices related to inflation. Besides these challenges, California is also facing a decline in population in some areas like Los Angeles as many young people leave the city or state to look for new jobs and more affordable housing. Declines in a city or state’s population can have a substantial effect on local businesses, which often see fluctuations in consumer spending and a decline in foot traffic as a result of these shifts. How is California’s economy performing? To answer this question, we analyzed consumer foot traffic to various place categories to determine how inflation and other factors like coronavirus variants are affecting California’s economy.

California’s Consumer Foot Traffic: An Economic Overview
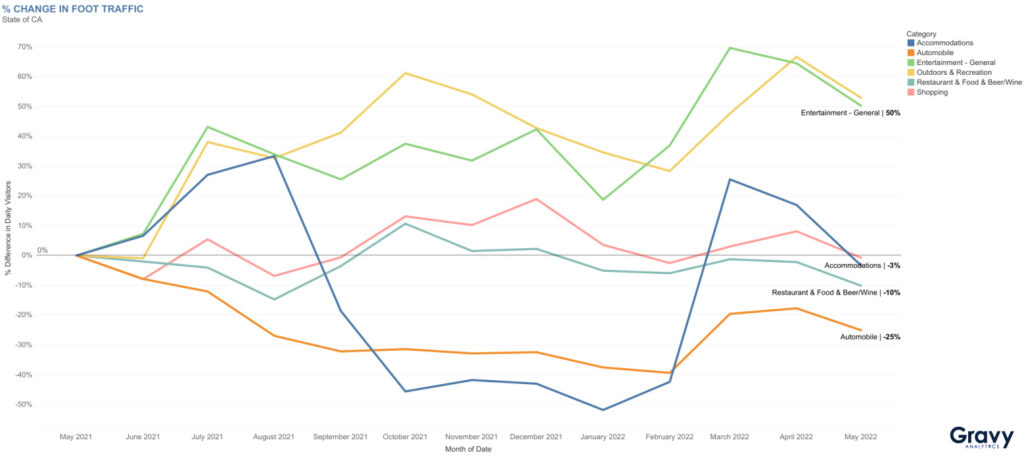
The categories of Entertainment – General and Outdoors & Recreation saw higher percentages of foot traffic year over year than other place categories in California. Foot traffic to general entertainment venues was 50% higher in May 2022, compared to May 2021. From tourist attractions to sports venues, there is definitely no shortage of things to do and places to explore in California. Disneyland and Universal Studios Hollywood are big tourist attractions in California; the reopening of these theme parks in 2021 could be the main reason why entertainment foot traffic is up significantly. California also boasts a large parks and recreation system that attracts both visitors and locals.
The category of Shopping remained relatively flat in terms of foot traffic, possibly due to consumers preferring to shop online rather than in store. Foot traffic to Accommodations was 3% lower, which reflects national consumer trends in hotel foot traffic that we detailed in a previous blog post. A recent increase in food prices due to inflation has caused many consumers to reevaluate their grocery shopping and dining habits. California’s restaurant and food store foot traffic is 10% lower year over year. In May 2022, foot traffic to automobile-related locations was 25% lower, compared to May of the previous year. With many consumers stretching their budgets, spending money on big purchases and expensive meals isn’t a high priority.
Hotel Foot Traffic in California
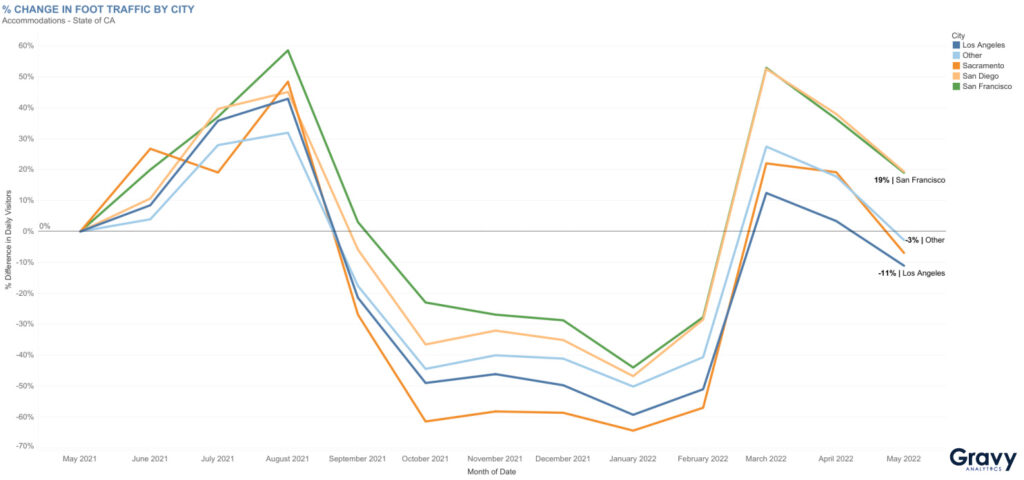
Hotel foot traffic declined significantly after August 2021, and remained below May 2021 levels until it peaked again in March 2022, more than likely a result of Spring Break and people going on delayed vacations from the previous year. By May 2022, both San Francisco and San Diego’s hotel foot traffic was 19% higher than May 2021. In contrast, Los Angeles was 11% lower during the same time period. L.A. is known as one of the most expensive U.S. cities to vacation in, but there might be other factors other than cost (e.g., coronavirus cases, event cancellations, etc.) that could have caused vacationers to reconsider a Hollywood vacation. San Francisco is also an expensive city for tourists to visit, but the price tag of a vacation in the “City by the Bay” didn’t seem to prevent people from booking their hotel stays.
Auto-Related Business Foot Traffic in California
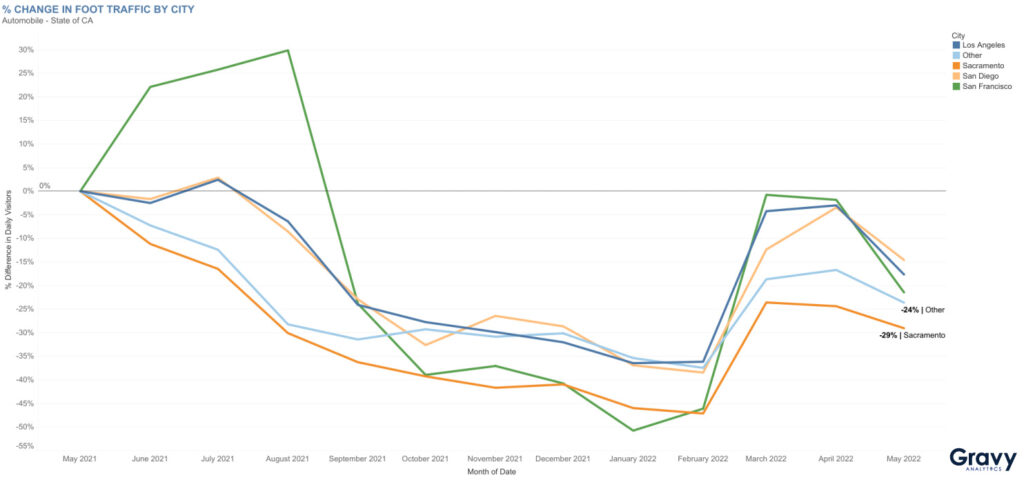
Most cities in California saw auto-related business foot traffic remain below May 2021 levels, except for San Francisco, which saw its traffic rise above those levels from June 2021 to August 2021. In July 2021, foot traffic to automotive businesses also peaked slightly in Los Angeles and San Diego, but then declined below May 2021 levels like other California cities. Out of the California cities analyzed, Sacramento saw the largest decline in foot traffic to automotive businesses year over year. By May 2022, foot traffic to auto businesses in Sacramento was 29% lower, compared to May 2021. The trends in foot traffic to auto businesses in California reflect the shifts in U.S. consumer confidence. Rising interest rates and high inflation caused consumers to pause spending on “big-ticket items” like cars.
Shopping Foot Traffic in California
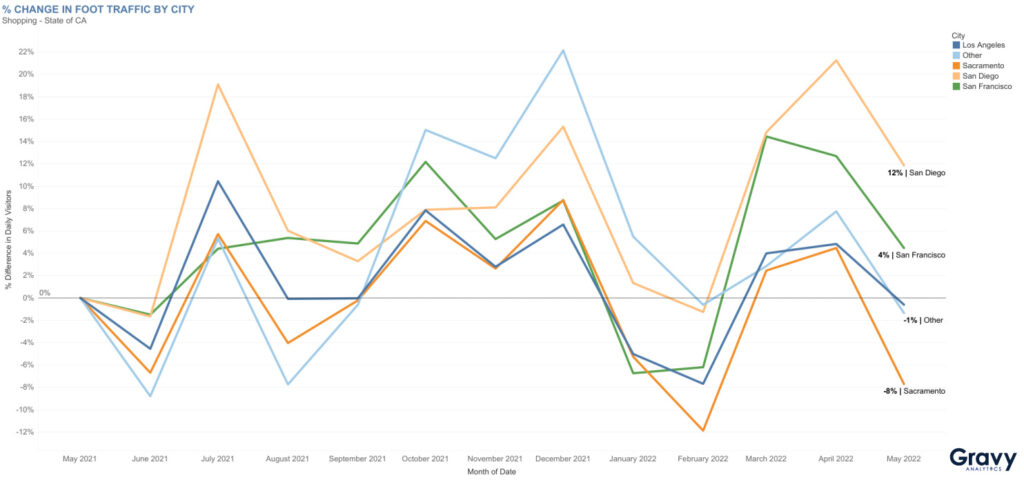
Shopping foot traffic trends vary significantly by city in California. In May 2022, foot traffic to shopping locations in San Diego and San Francisco was 12% and 4% higher, respectively, than May 2021. Both cities are popular shopping destinations for tourists and locals, which could explain why foot traffic is higher than other California cities. Sacramento’s shopping destination foot traffic was 8% lower in May 2022, compared to that same time period a year prior. Surprisingly, L.A.’s shopping foot traffic was almost flat in May 2022. Because Los Angeles is known for its luxury shopping, people may have been discouraged from visiting some shopping destinations.
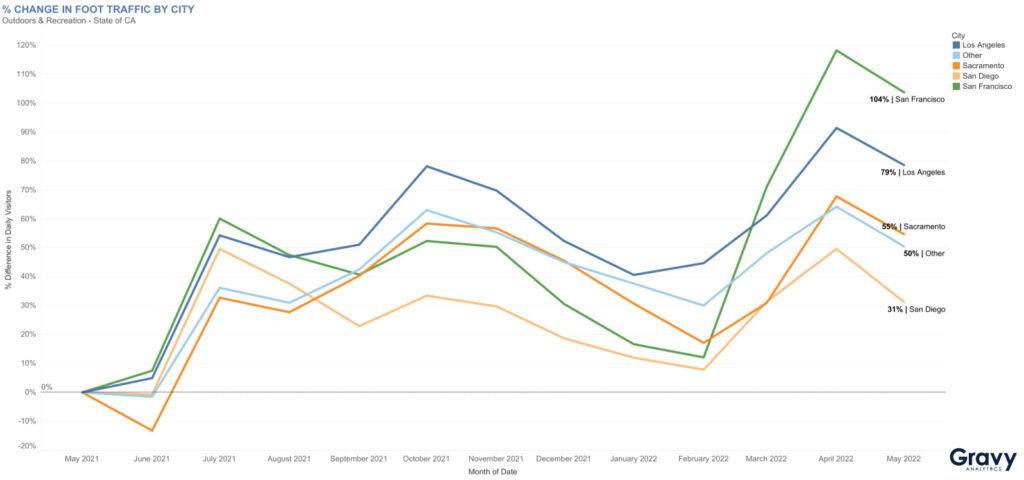
Outdoors & Recreation Foot Traffic in California
California’s warm weather is ideal for outdoor activities. Its beaches and parks are popular places to visit—no matter the time of year. Our data shows that foot traffic to outdoor and recreation locations in California has been above May 2021 levels since July 2021. In May 2022, foot traffic to outdoor and recreation areas in San Francisco was 104% higher, compared to May 2021. California’s mask mandate and other coronavirus policies might have caused some consumers to decide to spend more time outdoors.
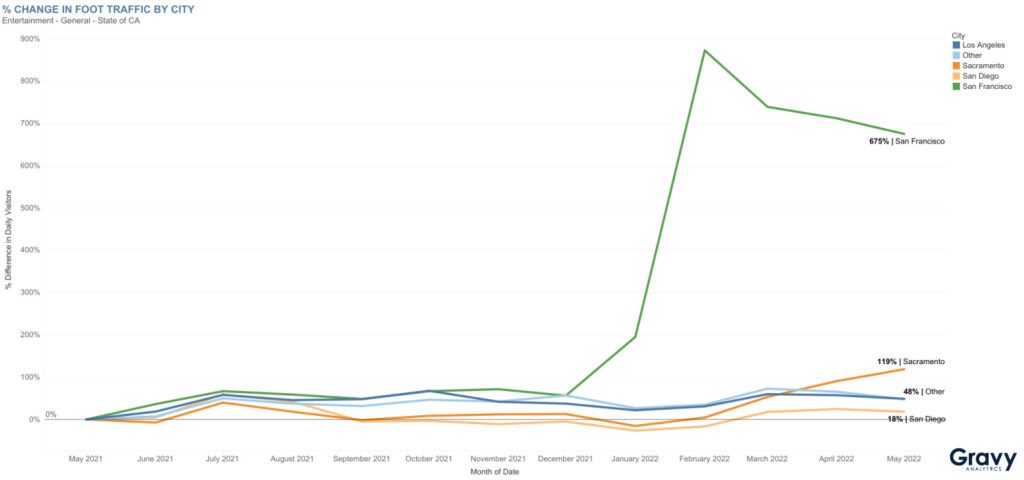
Entertainment Foot Traffic in California
Year over year, foot traffic to entertainment venues in San Francisco was 675% higher. Sacramento also saw foot traffic at its entertainment venues increase above 100%; May 2022 traffic was 119% higher than May 2021. Other cities in California like San Diego saw relatively flat foot traffic at entertainment destinations. San Francisco isn’t home to any major theme parks, but it does have many unique tourist attractions. However, those attractions could have only just recently reopened, which could explain why San Francisco’s entertainment foot traffic increased significantly after December 2021.
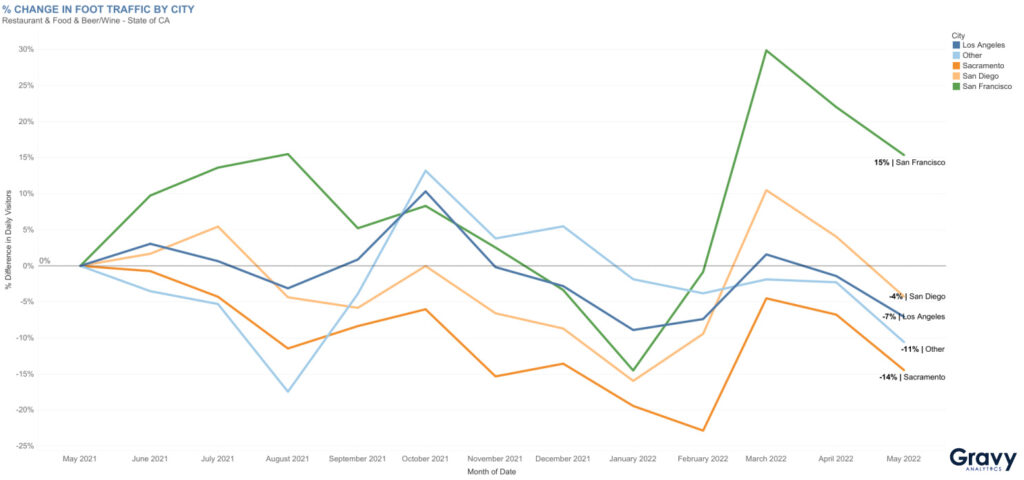
Restaurant & Food Store Foot Traffic in California
Foot traffic to California restaurants and food stores varies significantly, depending on the city. Rising food prices, along with California’s COVID restrictions in 2021, may have driven more consumers to eat at home and reduced in-person grocery shopping trips. Although, this doesn’t seem to have discouraged diners and grocery shoppers in San Francisco; May 2022 foot traffic was 15% higher, compared to May 2021. San Francisco is known for its food scene, especially with tourists who are on vacation, and is a big hub for large tech conferences, which could explain why it saw a significant increase in foot traffic to restaurants during the summer of 2021 and spring of 2022.
Predicting California’s Economic Trends with Location Analytics
So far in 2022, all California cities are seeing huge consumer interest in outdoor and recreational activities. It appears that this consumer habit isn’t going anywhere any time soon; this is a trend that we observed early on during the emergence of the COVID-19 pandemic in 2020. Despite a large number of people moving from San Francisco, our foot traffic data shows that certain sectors of its economy are performing rather well.
With location analytics, local municipal leaders and organizations in California and other states can enrich the state’s economic data with foot traffic data to understand what consumers are interested in and how that shapes their state’s economy. For more information on how consumer foot traffic data can be used to understand economic trends in states and cities, contact one of our location intelligence experts today.