DATA VISUALIZATION
Brand Performance
Retail foot traffic, as measured by location intelligence, can provide real-world insight into brand performance.
About this Dashboard
Brand performance isn’t only measured in terms of retail sales or stock price. Retail foot traffic, as measured by location intelligence, can provide real-world insight into a brand’s popularity. The number of people who shop at Wegmans, dine out at Chipotle, or stay overnight at Hilton can tell us a lot about the overall business health of a store, restaurant, or hotel chain.
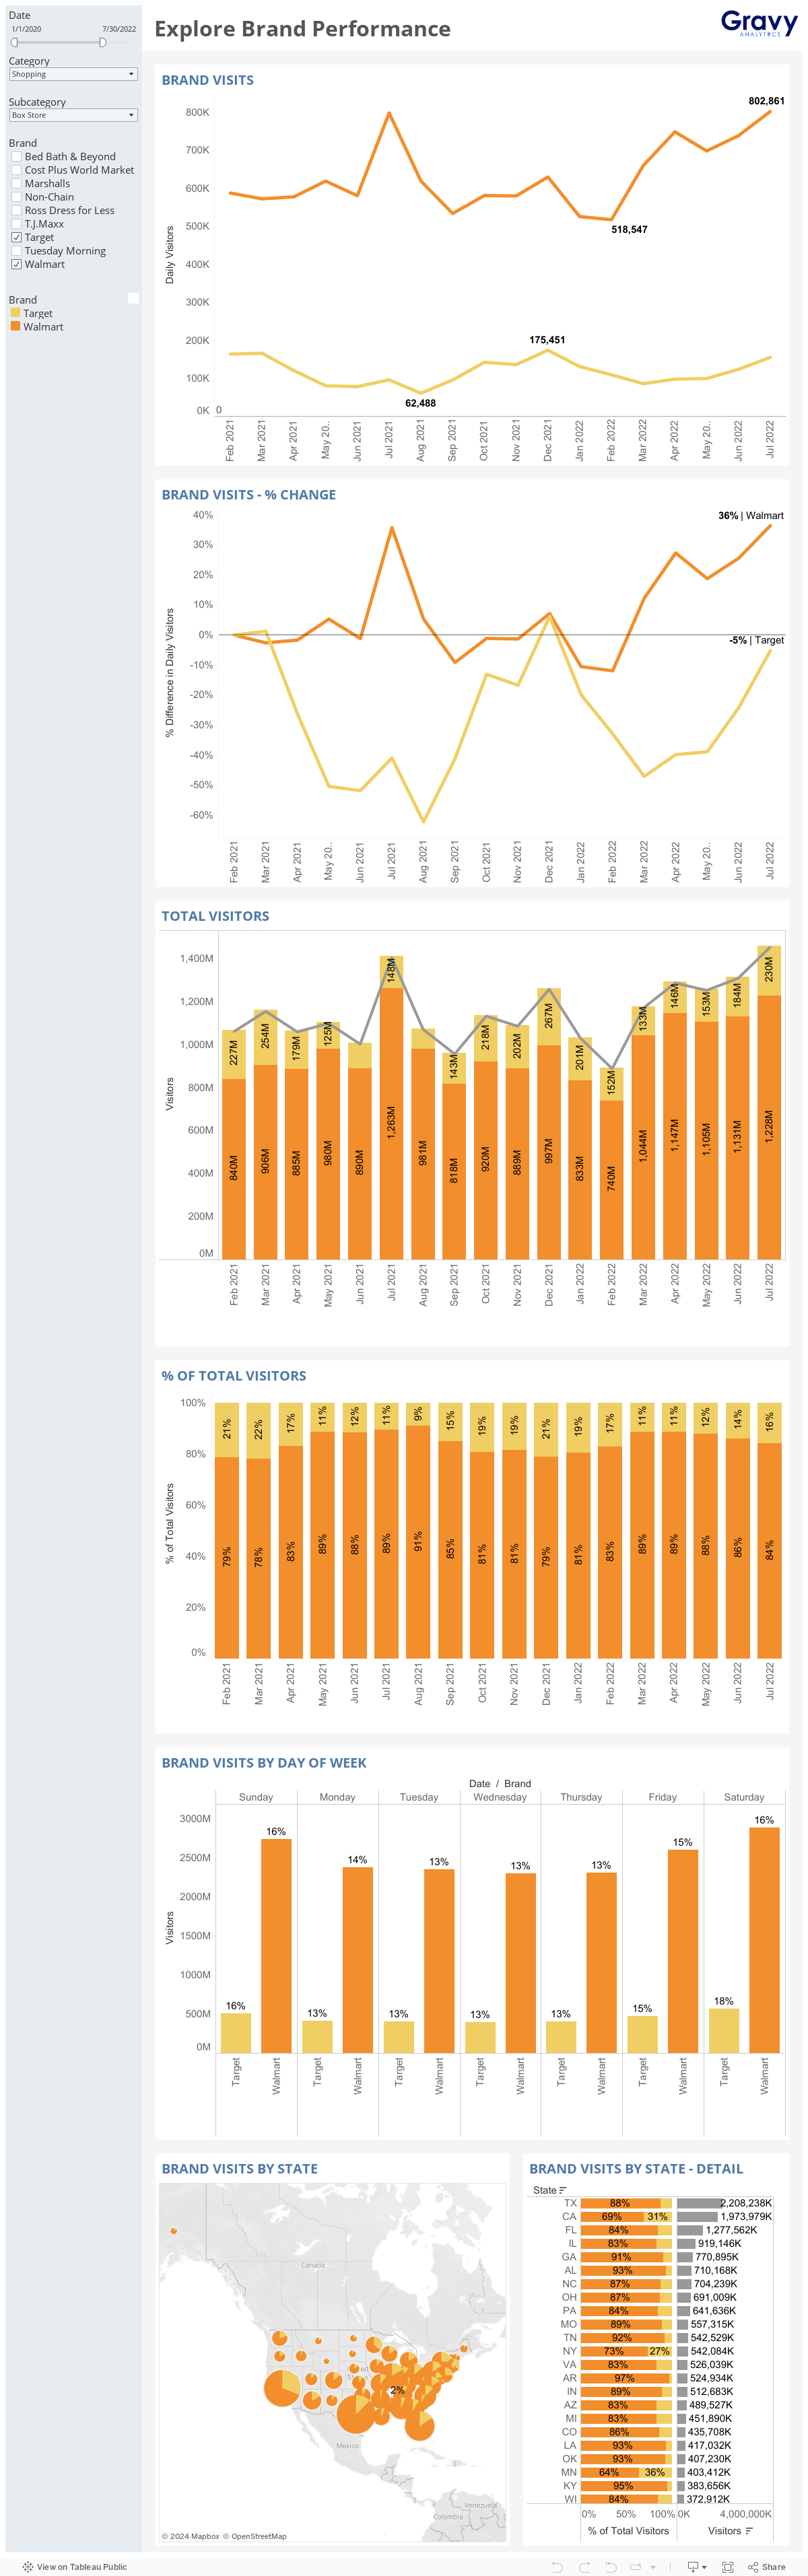
Gravy Visitations measures consumer visits to thousands of leading brands. The Brand Performance dashboard visualizes consumer foot traffic changes at 200+ leading brands across all 50 U.S. states since the start of COVID-19. This visualization is updated monthly and demonstrates how consumer behavior and priorities can vary widely by region or state.
Visitations and related metrics, including foot traffic trends, are most often used for market research or competitive intelligence. Understanding foot traffic trends is helpful when researching consumer trends or making investment decisions. From a competitive intelligence standpoint, foot traffic is an important indicator of brand strength and can help marketers better understand how their brand compares to other brands in the space.
As the economy moves toward recovery, brand intelligence will most likely be a top priority for many companies. When you think of brand performance, you might think about brand equity, customer sentiment, sales data, and marketing KPIs first. Foot traffic data can be a powerful addition to these traditional datasets and round out your brand performance metrics overall.
Data Methodology
Built using the Gravy Visitations dataset, visits to brands are tabulated whenever consumer mobile devices enter geofences associated with a brand. In total, Gravy captures more than 1B+ consumer visits to commercial places of interest every month.
Default brand metrics are shown at the initial page load. Select a different category or subcategory to explore available brands in more detail. Choose a selection of brands to display metrics for those brands in the charts. Detailed metrics may be obtained by placing your cursor over the point of interest on the chart or map.
Use of Data for Media and Research Purposes
- If you are a journalist or researcher and would like to use this Brand Performance data or other Gravy insights for media or research purposes, please let us know at info@gravyanalytics.com.
Get started with best-in-class data
All data presented in the dashboards is available on the Gravy Analytics platform.